The cryptocurrency market records a decisive move in the daily price action of Shiba Inu (SHIB). Following a prolonged bearish phase of over 300 bars and a secondary 53-bar correction, the price structure consolidates a critical accumulation zone successfully defended at the $0.00000405 support level (Bar 1). During the sessions of bars 31 and 32, institutional buying order flow bursts in violently, breaking above the 20-period exponential moving average (20 EMA) and challenging key local resistances amid a scarcity of selling pressure.
The Historical Floor and Supply Absorption
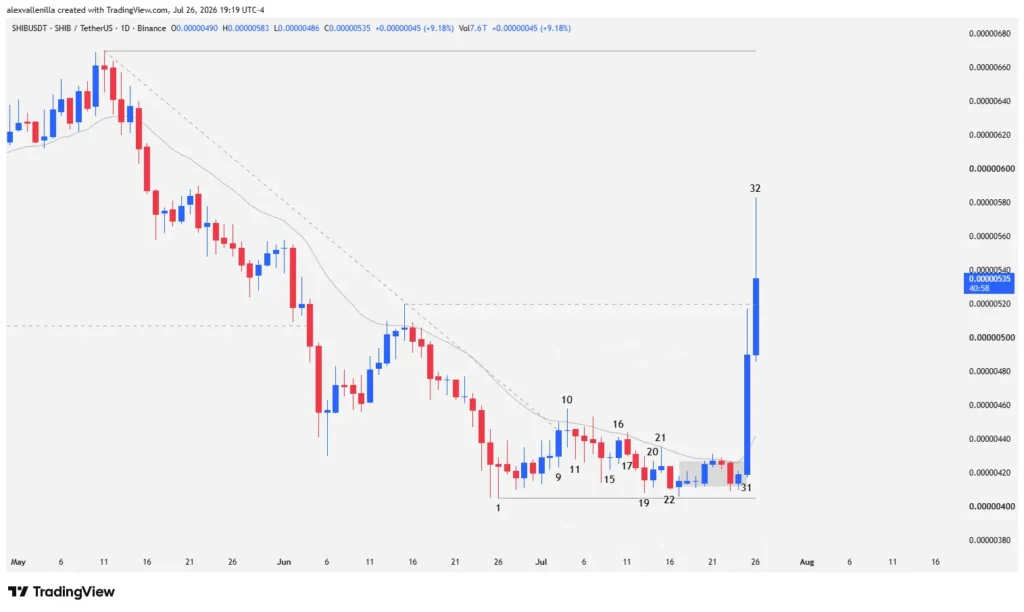
The dynamics of the SHIB daily chart expose a remarkably clean bearish exhaustion structure. It all begins at Bar 1, where the decline hits a dead stop by marking the cryptocurrency’s all-time low at $0.00000405. Far from yielding, this doji candle featuring a prominent lower shadow seals a non-aggression pact by sellers.
As the chart progresses, the bears’ inability to pierce this floor becomes evident. From Bar 14 to Bar 22, bearish attempts to test the Bar 1 low fall increasingly short. Candles register reduced bodies and notable lower shadows, demonstrating clear supply absorption by institutional buyers and retail traders keeping an eye on deep value.
Congestion and the Peak-and-Range Pattern
Following the failed effort by sellers in Bar 22, the price enters a congestion phase or narrow-range channel extending over eight consecutive sessions. During this period, highs systematically compress below the 20 EMA, while lows safeguard the Bar 1 support.
This classic behavior of low compression against a key support shapes a typical accumulation zone at the end of prolonged downtrends. Bulls lay the groundwork, accumulating inventory while seller liquidity completely dries up.
Technical Analysis (Top Priority)
The technical climax and true order flow X-ray manifest in the closing sequence of the current move:
Bar 31 (The Institutional Entry): Strong hands burst into the market with a high-conviction bullish candle. The body of the bar forcefully breaks the 20 EMA, and its high surpasses all previous records, including the ceiling of Bar 10. Its tiny lower shadow confirms that buying orders dominated the session right from the opening bell, while a slight upper shadow reflects initial profit-taking upon grazing the $0.00000535 resistance, the last relevant high of the 53-bar bearish channel.
Bar 32 (Acceleration and Volatility): The bullish momentum unleashed in the previous session attracts fresh capital inflows, triggering a volatility expansion. At the time of reporting, price action decisively pierces the $0.00000535 resistance. However, this nearly vertical move at the upper end prints a considerable upper shadow—an unequivocal symptom that short-term traders are taking profits and testing the strength of the breakout.
Structural Context and Next Targets
Despite the forcefulness of bars 31 and 32, the macro technical landscape demands caution. SHIB is building a floor following a macro downtrend of over 300 bars. To confirm an absolute structural trend reversal, bulls must strictly target the macro resistance located at $0.00000670 (the ceiling of the original bearish trendline).
If buying pressure loses steam and fails to consolidate current levels, the price could experience a logical corrective pullback. In that scenario, the primary support to watch is located at the Bar 10 high ($0.00000458), a zone where a previous local resistance turned support converges with the dynamic support of the 20 EMA.
The technical reaction on the SHIB daily chart proves that price action remains the most faithful map of market psychology. The surgical defense of support at Bar 1 and the subsequent expansion of bars 31 and 32 rewrite the digital asset playbook, reminding us that behind every major accumulation lies a silent struggle between exhausted supply and institutional demand.
Disclaimer: This article is for educational and informational purposes only. It does not constitute financial, legal, or investment advice. Cryptocurrency trading carries a high risk of capital loss; always conduct your own research before trading in the markets.

Communications Professional. Crypto Enthusiast. Economic Journalist. Bitcoiner & Altcoiner.