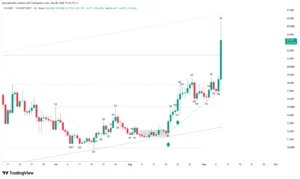
PancakeSwap (CAKE) token buyers are mounting a decisive offensive on the daily timeframe (1D). Following a prolonged period of selling pressure that dominated the underlying structure for nearly 300 daily candles, current price action reflects strong defense at key levels and a breakout from a micro-range of congestion above the 20-period exponential moving average (20 EMA). Bulls are now targeting short stops and testing previous local highs, opening the door for a medium- to long-term trend restructuring.
Market Structure and Order Flow Dynamics
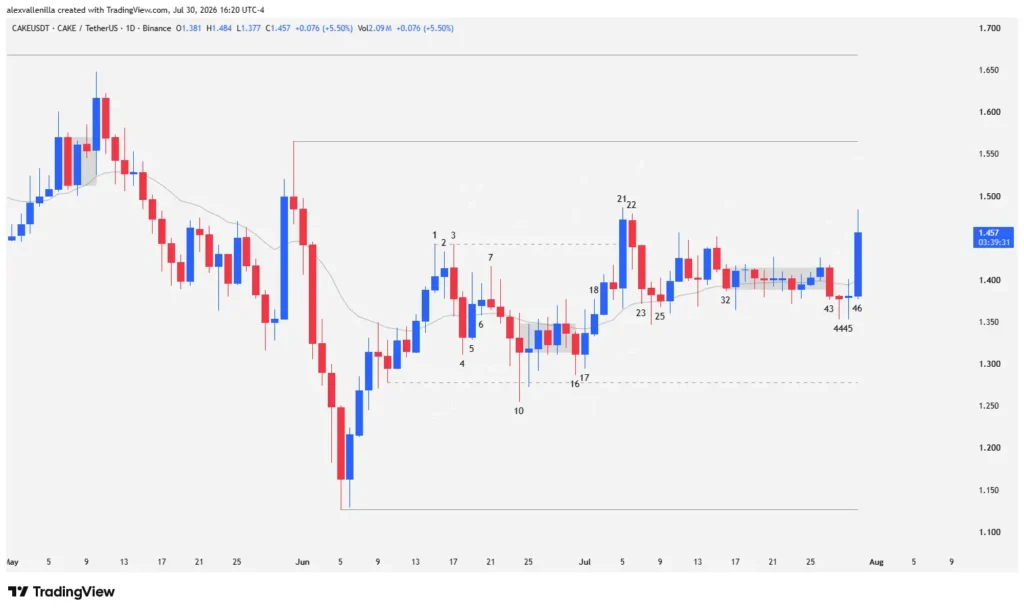
CAKE’s price action shows a critical transition from a extended distribution phase to an accumulation process and structural support retest. Price action built a defensive floor following the initial buying push generated at the $1.127 support zone.
Throughout recent developments on the daily chart, sellers repeatedly attempted to maintain control by driving pressure near resistance zones. However, the bears’ inability to print new absolute lows has weakened the dominant bearish bias. Buyers capitalized on this supply exhaustion to build higher lows, establishing a solid launching pad supported by the $1.278 zone.
Initial Impulse Leg and First Resistances (Bars 1 to 8)
Bar 1: Completes a two-legged upside move originating from major support at $1.127. The high of this bar sets a new local resistance at $1.46, representing a relative lower high compared to the key $1.565 level.
Bar 2: Displays residual bullish continuation that stalls the buying momentum by exhausting breakout volume.
Bar 3: Sellers react by printing an outside bar. The high of Bar 3 forms an exact double top with the high of Bar 1, setting up a bear flag pattern.
Bar 4: Confirms the pullback initiated in Bar 3 and manages to close below the 20 EMA, triggering profit-taking.
Bar 5: Market volatility expands. Bulls immediately absorb the drop from Bar 4; the low of Bar 5 holds above the previous low and pushes the close back above the 20 EMA. Despite the recovery, Bar 5 leaves a long upper tail, demonstrating active supply defending the $1.46 resistance.
Bar 6: An inside bar and Doji-type indecision candle, reflecting a tactical pause in volatility.
Bar 7: Features an inverted hammer (bearish pinbar). Although buyers attempted to extend the move, bears took control to close in the lower range with an upper tail significantly larger than the body. Consecutive upper tails on Bars 5, 6, and 7 signal a clear pattern of selling pressure.
Bar 8: Confirms the bearish bias by breaking below the low of Bar 7, dragging price back beneath a completely flat 20 EMA.
Support Test and Breakout Trap (Bars 9 to 20)
Bar 10: Bears complete an extended two-legged pullback from the high of Bar 1 to the low of Bar 10. This candle tests local support at $1.278, the structural pivot of the previous bullish leg. Although Bar 10 pierces support intraday, supply fails to sustain the breakout: the body remains very small and fails to close below the low of Bar 9, overlapping within its range. The long lower tail signals aggressive buyer entry.
Bar 11: Prints another noticeable lower tail. The sequence formed by Bar 9, Bar 10, and Bar 11 sets up a buying pressure pattern. However, following Bar 10, price enters a micro-range congestion phase below the 20 EMA.
Bar 16: Sellers attempt to break out of the micro-range to the downside. However, the breakout lacks volume and conviction; Bar 16 fails to precisely test the $1.278 level. Buyers react, forming a strong lower tail that holds the structure intact.
Bar 17: Bulls spring a bear trap by trapping the short sellers from Bar 16. Bar 17 invalidates the micro-range breakdown, delivering a failed breakout signal that acts as a buy trigger for price action traders.
Bar 18: Confirms the signal from Bar 17 with a firm close above the 20 EMA.
Institutional Order Flow Entry and Consolidation (Bars 21 to 42)
Bar 21: Following a failed pullback at Bar 20, buyers surge onto the chart. A high-conviction candle (bullish marubozu) driven by impressive trading volume penetrates and breaks above the high of Bar 1. This price action confirms big-money involvement and attempts to extend the larger macro bull cycle.
Bar 22: An inside bar that temporarily halts momentum from Bar 21.
Bar 23: Confirms the pause with a pullback whose lower shadow merely retests the 20 EMA as dynamic support.
Bar 24 and Bar 25: Bar 25 prints a tiny body compared to Bar 24 and Bar 23, signaling clear seller exhaustion. This highlights the lack of supply available to push prices lower.
Bar 32 to 42: Starting at Bar 32, price action enters a tight compression. Multiple small-bodied candles with tails in both directions weave through the 20 EMA in a state of equilibrium and low volatility.
Current Trigger and Active Structure (Bars 43 to 46)
Bar 43: Bears break out of the micro-range intraday and manage to close below the 20 EMA.
Bar 44: Attempts to confirm the bearish breakdown from Bar 43. However, supply collapses before taking out the previous low. Price rejects the lows and prints a hammer with a long lower tail, signaling seller weakness.
Bar 45: Prints a Doji whose low matches the low of Bar 44 exactly, validating a micro-structure double bottom pattern, or Tweezer Bottom. This candle traps late sellers.
Bar 46 (Current Developing Bar): Bulls unleash a powerful move. Bar 46 breaks out above the congestion zone with a high-conviction candle that aims to test the high of Bar 21.
Projected Scenarios and Invalidation Levels
Bullish Scenario: If buyers maintain momentum and close decisively above the high of Bar 21, the market clears a path toward major resistance at $1.565. A clean, sustained breakout above $1.565 would pave the way to $1.668, a technical milestone that would formally invalidate the 300-day downtrend and kick off a new bullish macro structure.
Bearish / Neutral Scenario: If Bar 46 faces rejection upon testing the Bar 21 high area and sellers force a close back below the 20 EMA, the asset will remain range-bound, relying on $1.278 as its primary defensive support level.
PancakeSwap displays one of the cleanest price action setups in the current altcoin market. Accumulation—evidenced by the series of absorption tails at key supports and the failed bearish breakout—confirms that demand is taking control of the order book. The upcoming test of $1.565 resistance will determine whether CAKE finally snaps its structural bear trend to launch a new markup cycle.
Disclaimer: This analysis is for educational and informational purposes only regarding Price Action methodology and does not constitute financial or investment advice under any circumstances.

Communications Professional. Crypto Enthusiast. Economic Journalist. Bitcoiner & Altcoiner.