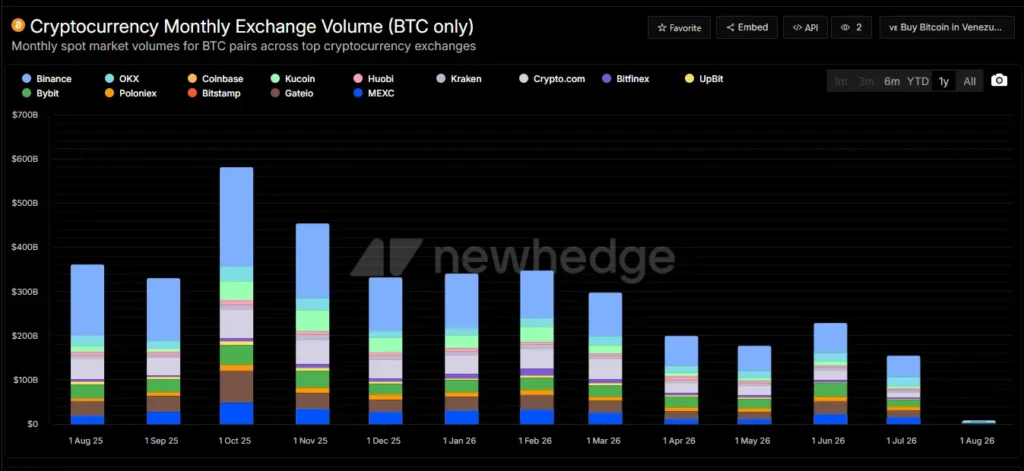
During July 2026, bitcoin trading volume on centralized exchanges (CEX) dropped to $155.58 billion, marking the lowest reading of the past twelve months according to on-chain data from New Hedge. This drastic contraction—which exceeds May’s low ($177.12 billion)—directly coincides with a prolonged downtrend dragging the market down since October 2025, when monthly volume hit an all-time high of $581.31 billion.
Anatomy of a Slowing Trend
The behavior of the crypto market in this stretch of 2026 exposes a widespread cooling of retail and institutional speculation on centralized platforms. The volume curve experienced a sustained decline following the October 2025 climax. Although June 2026 saw a breakout attempt that temporarily halted the drop with $228.59 billion, this momentum lacked follow-through, sinking in July to the new annual floor.
Despite this contracting landscape, the data reveals clear signs of macrostructural stabilization. After registering a meager volume of $200.27 billion in April 2026, the cryptocurrency market charted a narrow plateau over the last four months. This range-bound behavior suggests that massive selling pressure is gradually losing steam.
The Role of Centralized Exchanges and the Spot Market
Within the intermediation ecosystem, Binance cemented its position as the centralized exchange with the highest dominance in the bitcoin spot market during this period, moving a volume of $49.7 billion.
However, transaction concentration on a single platform fails to offset the overall sluggishness of global volume. Low order book activity reflects an exhaustion phase where institutional and retail participants reduce exposure while waiting for clearer fundamental catalysts.
Technical Analysis: Price Action Reading and Order Flow
From the perspective of strict price action and order flow analysis, the confluence between a prolonged downtrend and the sharp drop in operating volume reveals a classic trend exhaustion scenario.
The Flow Diagnosis: When trading volume lows coincide with price contraction phases hovering around the psychological zone of $60,000, the market typically displays an absence of aggressive selling interest (a lack of participants willing to cross the price lower at current levels).
Candle Reading and Structure: Candlestick structures on higher timeframes show narrow range bars devoid of significant bullish or bearish volume expansion. This indicates that major market makers and smart money are absorbing floating supply within a defined range.
Tactical Implication: Historically, extreme volume contraction within a macro support zone (like the $60,000 floor) does not confirm an immediate bullish reversal, but it does invalidate the aggressiveness of the previous downtrend. The price rests because institutional selling pressure has temporarily neutralized, leaving the market in a volatility compression phase while awaiting a breakout from current operational ranges.
The drop in bitcoin volume to annual lows does not necessarily represent definitive structural weakness, but rather a phase of deep operational pause. The price’s ability to hold the $60,000 zone despite the collapse in CEX liquidity demonstrates that the market is navigating a critical period of silent accumulation and floor validation.
Disclaimer: This article is for educational and informational purposes only and does not constitute financial, legal, or investment advice. Trading cryptocurrencies and digital assets carries high risks; rigorous risk management is recommended before executing trades in financial markets.

Communications Professional. Crypto Enthusiast. Economic Journalist. Bitcoiner & Altcoiner.