The decentralized finance ecosystem closely watches Falcon Finance’s (FF) recent movements on its daily timeframe. After piercing previous accumulation structures and overcoming critical supply barriers, the asset experiences a decisive pulse between institutional buyers and sellers defending historical highs. The recent formation of high-volatility bars sketches a technical scenario of maximum attention for traders focused on reading order flow.
From Accumulation to Momentum: The Birth of the Trend
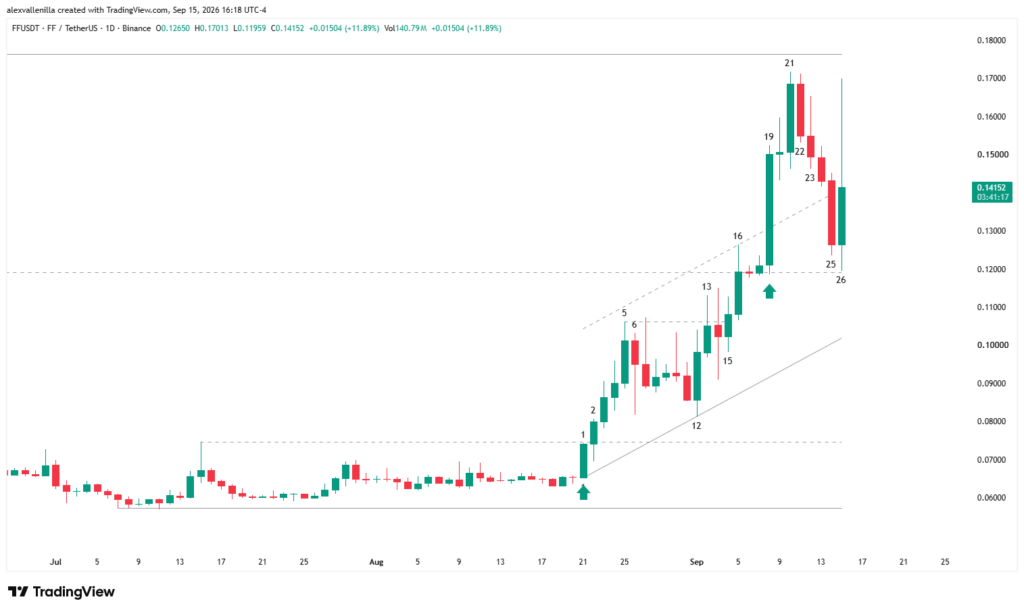
Falcon Finance’s price traded within a well-defined range, bounded by resistance at $0.0747 and support at $0.0572, after concluding a bearish cycle that found its bottom from the $0.1191 high.
Bar 1 broke this equilibrium with high conviction and a notable increase in trading volume, leaving no lower tail and configuring a high 1 buy signal. By failing to immediately clear the $0.0747 level, the market demanded a confirmation that arrived with Bar 2, which pierced the key level and transformed it into support via polarity change, backed by a volume that doubled the twenty-day average.
Climax and Battle at the Higher Levels
The bullish progression found acceleration in Bar 5, a wide climatic body that triggered profit-taking alerts by leaving a relevant upper wick and marking a local top at $0.1061. Following a two-leg pullback of low intensity and overlapping, Bar 12 acted as a pivot point through an outside formation that halted the decline and served as an anchor to plot a twenty-five-bar bullish trendline.
The definitive momentum gained strength in Bar 19, where the entry of strong hands triggered a 24.12% expansion in its body, decisively breaking the ceiling of the bullish channel and pulverizing the structural resistance of $0.1191 with doubled volume relative to its moving average.
Technical Analysis: Reading Current Order Flow
The current structure concentrates on the development of Bar 26, a massive-range candle reflecting a fierce struggle.
Bar 21 to 25: Following the bullish attempt halted before reaching the key resistance at $0.1764, the price structured a three-bar pullback. Bar 25 functioned as an acceleration and capitulation bar, attracting institutional buyers interested in buying the dip within a macro uptrend.
Bar 26 (In development): This outside bar exhibits extremely high trading volume. Along its path, buyers tried to retake control toward the $0.1764 target, but collided with violent profit-taking at the upper part, printing a considerable upper wick that evidences supply defense at that resistance zone.
Falcon Finance validates a structural transition from accumulation to a medium-term bullish channel. Buyers’ ability to sustain the price above the $0.1191 support will determine the viability of a new assault toward the $0.1764 barrier, whose breakout would open the doors to macro projections targeting the $0.30 level.
Disclaimer: This article is for educational and informational purposes only. It does not constitute financial advice or an investment recommendation. The crypto market presents high volatility; perform your own research before trading.

Communications Professional. Crypto Enthusiast. Economic Journalist. Bitcoiner & Altcoiner.