In recent sessions, the Binance Coin (BNB) ecosystem staged a dynamic move on the daily chart. Driven by a decisive breakout of key resistances at $633 and the invalidation of a historical bull trap at $745.74, the price confirms a new mid-to-long-term bullish trend structure. Despite a recent corrective phase characterized by low bearish conviction, current price action sketches a double bottom scenario and the pinpoint defense of the lower trendline, setting the stage for potential new impulses.
Channel Breakout and Bullish Trend Confirmation
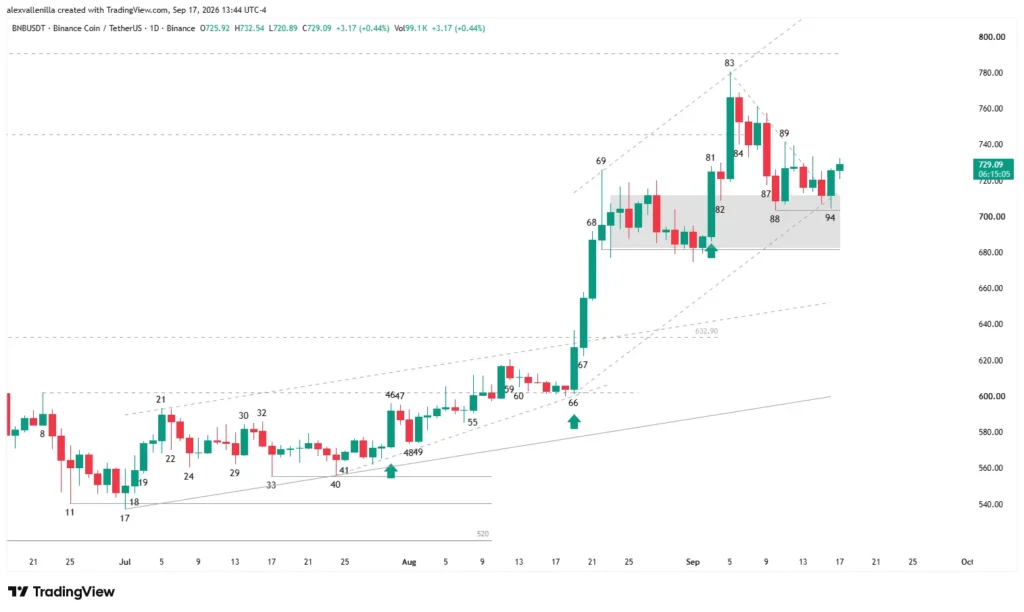
Bullish momentum gained forceful traction starting from bar 68, a high-conviction candle that confirmed the breakout of the upper side of a prior bull channel and surpassed the $633 resistance, accompanied by trading volume that doubled the 20-day average. Following a continuation attempt at bar 69 (an inverted hammer that tested $726 and showed some profit-taking), the market temporarily entered a barbed wire or micro-range pattern.
The definitive breakout of this congestion arrived with bar 81 and consolidated with bar 83, a potent bull bar with no lower tail that breached the structural resistance at $745.74. This level represented the high of a previous bull trap; by surpassing it, the price invalidated that prior bearish structure and opened the doors to a new 29-bar acceleration channel with two clear legs.
Technical Analysis: Correction Loses Steam and Double Bottom Resurfaces
The corrective phase following bar 83 attempted to push lower via bar 87, a high-conviction bear candle with a clearly counter-trend nature. This drop found an immediate halt at bar 88, whose low established a local support at $703.62 as it moved into the previous congestion zone.
Bears’ attempts to maintain control failed: subsequent bars featured small bodies, high overlap, and depressed trading volume, evidencing selling exhaustion. Finally, bar 94 acts as an outside reversal bar. This structure respects the new bull channel trendline—anchored after an adjustment at bar 93—and sets up a double bottom by not marking new lows relative to bar 88.
With bulls successfully defending the zone and breaking a micro bear channel, the current structure suggests the main trend remains intact since bar 66.
Trading Scenarios and Projections
Bullish Scenario (Continuance): If a new bull candle prints after bar 94, closing above its high, a high-probability buy setup like a High 2 triggers. Surpassing this level enables long position scale-ins with a primary target in the $791 resistance zone and the ceiling of the accelerated channel.
Bearish Scenario (Invalidation): To deteriorate the current bullish structure, sellers must invalidate the support at the low of bar 88 ($703.62) and decisively pierce the base of the extended congestion ($681.80). Until that happens, pullbacks continue to serve as consolidation opportunities within the macro trend.
Price action in BNB demonstrates structural solidity. The weakness shown in corrective pullbacks—contrasted with the punchiness of high-volume bull bars—confirms that institutional buying flow dominates the market, positioning the asset to target higher prices in upcoming sessions.
Disclaimer: This article is for educational and informational purposes only and does not constitute financial or investment advice. Cryptocurrency trading involves high risks; conduct your own research before trading.

Communications Professional. Crypto Enthusiast. Economic Journalist. Bitcoiner & Altcoiner.