

Despite the Solana ecosystem leading in stablecoin volume and processing billions of transactions, its native asset remains trapped in a technical tug-of-war. After months of decline, daily charts are finally flashing signs of a potential structural shift that has investors on edge: we either break resistance toward $121 or sink back into the boredom of a sideways range.
The Divorce Between Network and Market
Kash Danda, COO of Jupiter, hit the nail on the head by pointing out the “massive disconnect” between Solana’s fundamentals and its price. While the network recorded 2 billion transactions in February and moved $650 billion in stablecoin activity, the SOL token reflects a 34% loss over the past year. “If you believe crypto is useful, Solana is the place to be,” Danda asserts, highlighting that technological success has yet to translate into market valuation.
The Chart Narrative: Bar-by-Bar Technical Analysis
To understand where the market is headed, we must dissect the current SOL/USDT price action under the lens of SOL technical analysis:
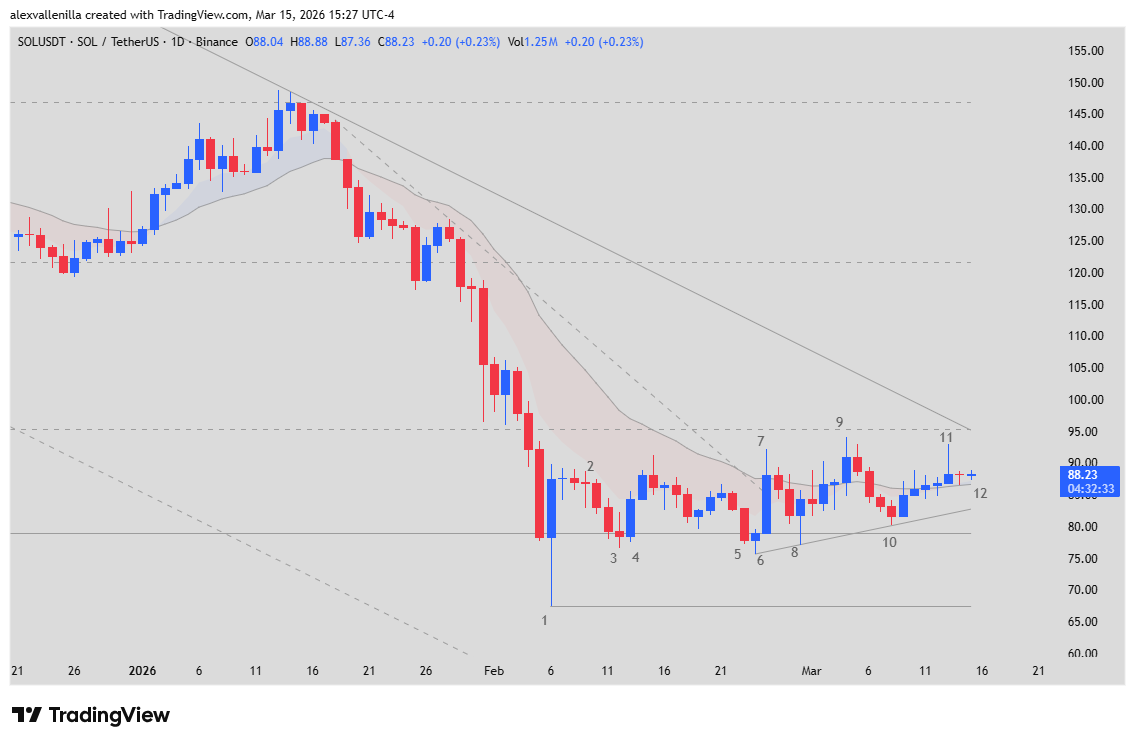
Bar 1: Marked a “Selling Climax” with a low of $67.50. This was the first wall to stop the crash following a historic 782-bar support level.
Bars 2 & 3: Bears tried to sink the ship with a “Low 2” setup, but Bar 3 showed indecision (doji) with a higher low.
Bar 4: A pivotal bullish bar that invalidated the previous sell signal, confirming the market has entered an accumulation phase.
Bars 7 & 8: Bar 7 saw the first touch of the 20-period EMA in 36 days, signaling an end to the accelerated downtrend. Bar 8, a bullish pin bar, ratified support at $79.
Bars 11 & 12: Bar 11 attempted to break $95 resistance but closed as a bearish pin bar. Currently, Bar 12 is a small doji, reflecting maximum uncertainty between buyers and sellers at the 20 EMA.
Scenarios: Where is the Money Flowing?
Analysis suggests the 178-bar bearish pressure is losing steam. If the Solana price manages a solid close above $95.26 (Scenario A, 55% probability), the next target is $121. Conversely, if the breakout fails, we could see the asset retesting $85 in a sideways grind (Scenario B, 35%). A resumption of the freefall (Scenario C) would only occur if we lose the critical $79 support.
Disclaimer: This article is for informational purposes only and does not constitute financial advice. Cryptocurrency investments carry high risk.
Communications Professional. Crypto Enthusiast. Economic Journalist. Bitcoiner & Altcoiner.