

After a “Bitcoin Season” that dominated headlines last week, momentum is finally shifting toward altcoins. Ether is leading an impressive recovery, posting 22% gains over the last year (1Y) and a 15% rally in the past month (1M). Although it remains down 21% year-to-date (YTD), current price action suggests the 160-day bearish sentiment may have finally reached its end.
Technical Analysis: The 12-Bar Narrative
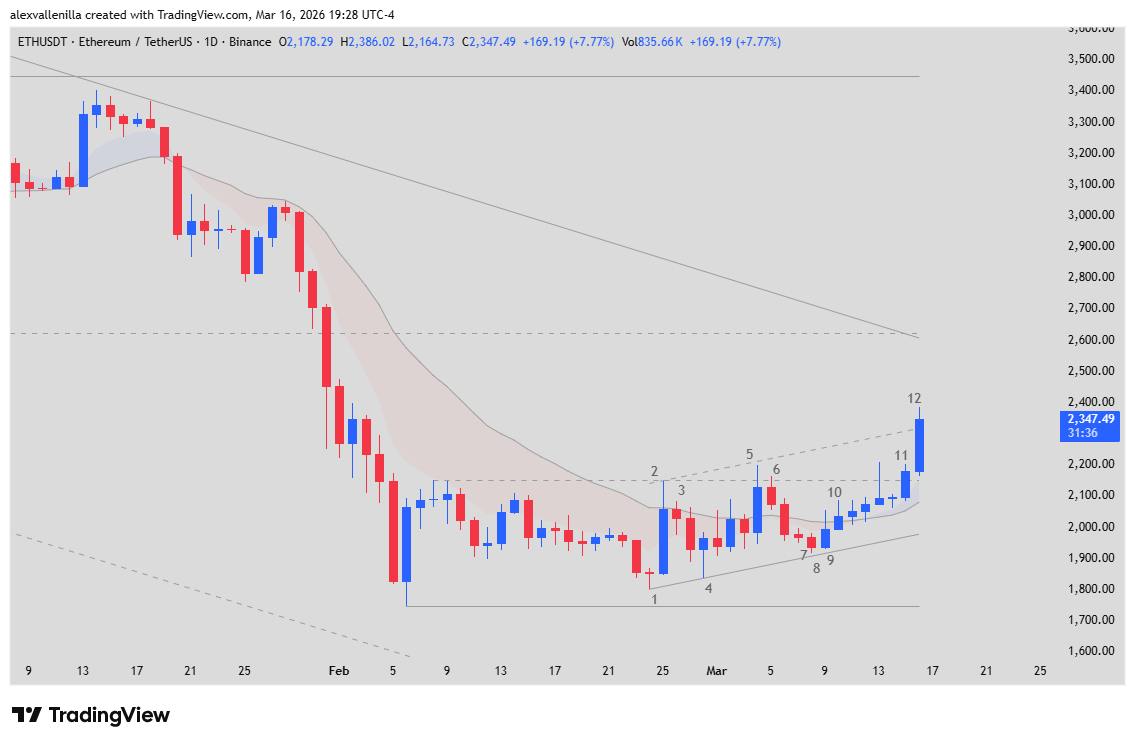
The daily chart tells a story of technical redemption. Following a climactic 160-bar downtrend, the market executed a 180-degree reversal through a “mini-bull channel” structure.
The Awakening and the Bear Trap
The transition began with Bar 1 and Bar 2, marking a definitive “change of character.” Bar 2 stood out as a high-conviction breakout that halted negative inertia and tested the 20-period Exponential Moving Average (EMA 20) for the first time in months.
However, the pivotal move occurred between Bars 7, 8, and 9. Bar 7 attempted to set up a sell signal (Low 2), but a lack of selling pressure allowed Bar 9 to quickly reclaim lost ground. This created a “Bear Trap,” forcing short-sellers to cover their positions and injecting bullish fuel into the price.
Range Breakout and Current Climax
Bar 11 served as the final confirmation, managing to close above the technical resistance between $2,150 and $2,200—a level that had kept the price “trapped” for over 30 days.
Currently, Bar 12 is the star of the show. With a 7.79% surge, this bar is “overshooting” above the upper line of the mini-channel. This phenomenon indicates imminent buying strength that could lead to parabolic acceleration.
Ethereum Scenarios: Where Are We Headed?
The crypto community is closely watching two potential paths following this volatility spike:
Bullish Continuity: If Bar 12 closes strong near its high of $2,386, the probability of hitting $2,620 is extremely high. This target is crucial, as it aligns with the primary long-term bearish trendline.
Healthy Retracement: If Bar 12 leaves a long upper wick, we could see a pullback toward the $2,150 zone. This move wouldn’t be negative; rather, it would serve to flip the old resistance into a firm new support level.
The buy signal triggered by clearing the high of Bar 8 and validated by Bar 11 remains active. As long as the price stays above $2,300, the bias remains bullish. Investors should keep a close eye on the $2,600 area, where dynamic resistance from the major trend could present Ethereum‘s next big challenge.
Disclaimer: This article is for informational purposes only and does not constitute financial advice. Cryptocurrency investments involve high risk.
Communications Professional. Crypto Enthusiast. Economic Journalist. Bitcoiner & Altcoiner.