

The altcoin market appears to have found some breathing room following the intense pressure felt since October 2025. With the CMC Altcoin Season Index climbing to 47 points (up from just 35 a week ago) and a global altcoin market cap exceeding $1.04T, investors are laser-focused on assets showing reversal signals. The most striking case is SYRUP, which, after a prolonged downturn, has posted a 22% weekly rally, triggering alarms across trading algorithms.
SYRUP Technical Analysis: The Roadmap to Recovery
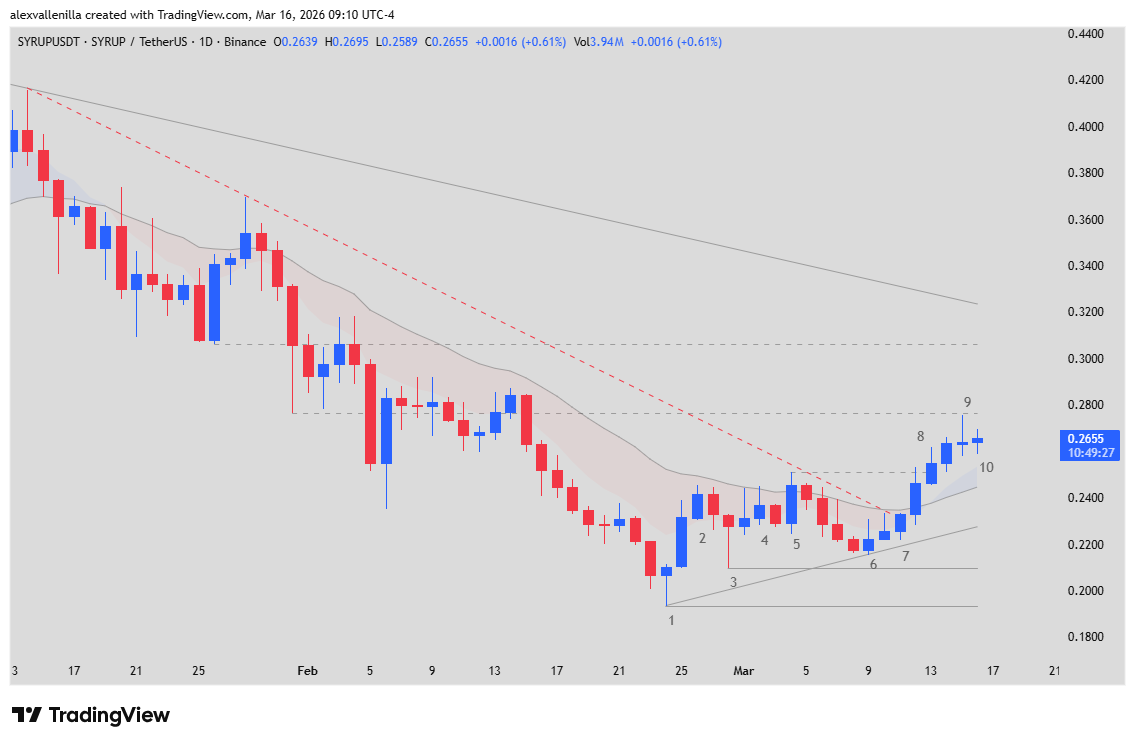
What we are witnessing on the daily chart is a structural transition known as a “Major Trend Reversal.” After 234 bars of bearish dominance, the price action has begun to craft a different narrative. Here is the detailed breakdown of the bars:
Bars 1 to 3 (Support and Accumulation): Bar 1 marked a bearish climax at $0.1935. However, Bar 3 established a higher low at $0.2098, breaking the “lower low” streak and confirming that “strong hands” are accumulating.
Bars 4 to 6 (Battling the 20 EMA): Following an initial failure at Bar 4, Bar 5 became the hero of the day—an outside trend candle that closed above the 20-period Exponential Moving Average (EMA). Bar 6 validated this move with a successful retest, confirming that SYRUP’s price is no longer yielding to selling pressure.
Bars 7 to 9 (Breakout Confirmation): The breakout of the 56-bar trendline at Bar 7 unleashed what traders call a “second leg up.” This acceleration pushed the token to a high of $0.2766 at Bar 9, hitting a key historical resistance level.
Bar 10 (Current Status): The market is currently printing a doji—a necessary pause after a vertical move. This is the moment where investors looking to invest in crypto today decide if there is enough momentum to shatter the current ceiling.
Scenarios: Where is the Token Headed?
The outlook is optimistic but requires caution. If the asset manages to clear $0.2766, the next technical targets sit at $0.3062 and eventually $0.3234, the level that will determine if the long-term downtrend is officially dead.
On the other hand, a healthy pullback toward the 20 EMA zone ($0.2445) would not invalidate the structure; rather, it would offer a new entry window into the newly formed bullish micro-channel.
Context: Between Optimism and Market Reality
Despite SYRUP carrying year-to-date losses of 18% in 2026, its recent recovery is a symptom of returning risk appetite in the sector. While Bitcoin maintains its dominance, Bitcoin-based networks and institutional lending protocols are gaining traction. SYRUP has already posted cumulative gains of 85% from its lows, proving that for those who can read the bars, opportunities emerge while fear still lingers.
| What is SYRUP and Why is it Key to the Ecosystem? |
|---|
| To understand this asset’s movement, it is vital to know that SYRUP is not just a speculative token; it is the governance and utility engine of Maple Finance. This platform acts as an institutional bridge connecting Traditional Finance (TradFi) with the DeFi sector.
By holding SYRUP, users participate in an economic model that recently evolved from inflationary rewards to a buyback system. This means a portion of the revenue generated by institutional loans is used to purchase the token on the open market, directly linking its value to the success and growth of the protocol. |
Disclaimer: This content is strictly for informational purposes and does not constitute financial advice. Cryptocurrency trading involves a high risk of capital loss.
Communications Professional. Crypto Enthusiast. Economic Journalist. Bitcoiner & Altcoiner.