

The cryptocurrency market is experiencing hours of high tension. After a failed attempt to conquer new highs, the Bitcoin price closed at $69,930, trapped between global monetary tightening and a technical setup that suggests caution. As the Bank of Japan (BoJ) holds rates and the Fed freezes the cost of money, investors are watching how the famous “yen carry trade” begins to take its toll on risk assets.
The Narrative of the Bars: The Hidden Language of the Chart
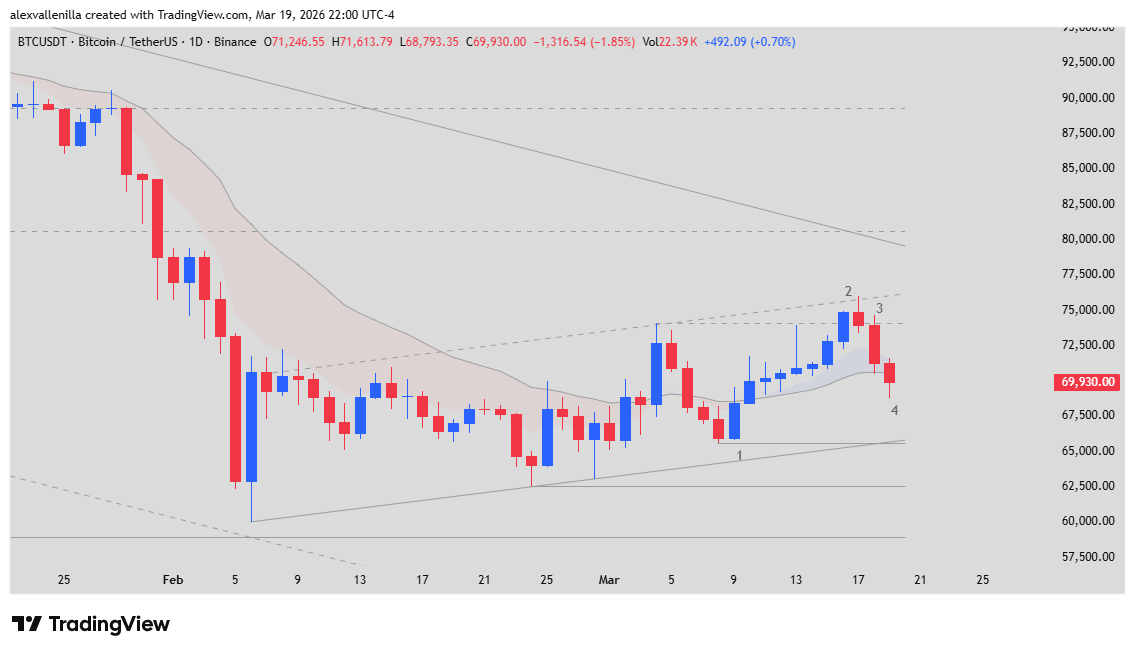
To understand where the Bitcoin price is headed, it is vital to dissect the daily (1D) price action. The battle boils down to four key movements:
Bar 1 (The Impulse): A solid-bodied bullish trend bar that liquidated bears in a short-covering rally. It appeared to be the definitive takeoff.
Bar 2 (The Trap): Known as an EMA Gap Bar, this candle hit resistance at $74,050. It was a “breakout failure” that left many buyers trapped at the top.
Bar 3 (The Counterattack): Sellers took control with a wide-range bearish bar, erasing the optimism of Bar 1 and confirming that the resistance at the highs is a wall difficult to climb.
Bar 4 (The Sell Signal): This is the highest priority bar. It is a Low 2 setup that closed below the 20 EMA. Although there was defensive buying at the lows, the weak close suggests that bullish momentum has evaporated.
Macroeconomics: Why the Yen and the Dollar are Punishing Your Wallet
It’s not all about Bitcoin technical analysis; the global context is heavy. The BoJ maintained the yen interest rate at 0.75% following recent hikes to curb inflation. This strengthened the yen, forcing those in the carry trade (borrowing cheaply in yen to invest in high-yield assets) to close positions and sell off their crypto holdings. Combined with a Fed keeping the dollar strong, risk appetite has diminished drastically.
What to Expect Now? Trading Scenarios
The current structure shows a clash between a 42-bar minor ascending channel and a 165-bar primary downtrend. If the Bitcoin price breaks the low of Bar 4, the most likely scenario is a test of the $65,500 zone, and even a drop toward $62,500 if the channel support does not hold.
Conversely, if the market manages to move sideways above the 20 EMA and invalidates the signal from Bar 4, we could see a new attempt toward $75,000. However, for now, the bears have the upper hand.
With a 19.11% loss over the last year and a monthly gain of just 4.06%, Bitcoin is in a “wait and see” zone. Discipline and risk management will be your best allies in this high-volatility environment.
Disclaimer: This article is for informational and educational purposes only. It does not constitute financial advice. Investing in cryptocurrencies carries a high risk of capital loss.
Communications Professional. Crypto Enthusiast. Economic Journalist. Bitcoiner & Altcoiner.