

The digital asset ecosystem is navigating a high-tension week. As the Fed and the Bank of Japan keep interest rates frozen and Middle East conflicts shake global markets, Ethereum’s price is fighting to hold onto vital support. After a recovery attempt that sparked hope for many, current price action suggests we might be facing a “bull trap” threatening to return the price to levels not seen since the beginning of the year.
The 5-Bar X-Ray: The Path Toward Indecision
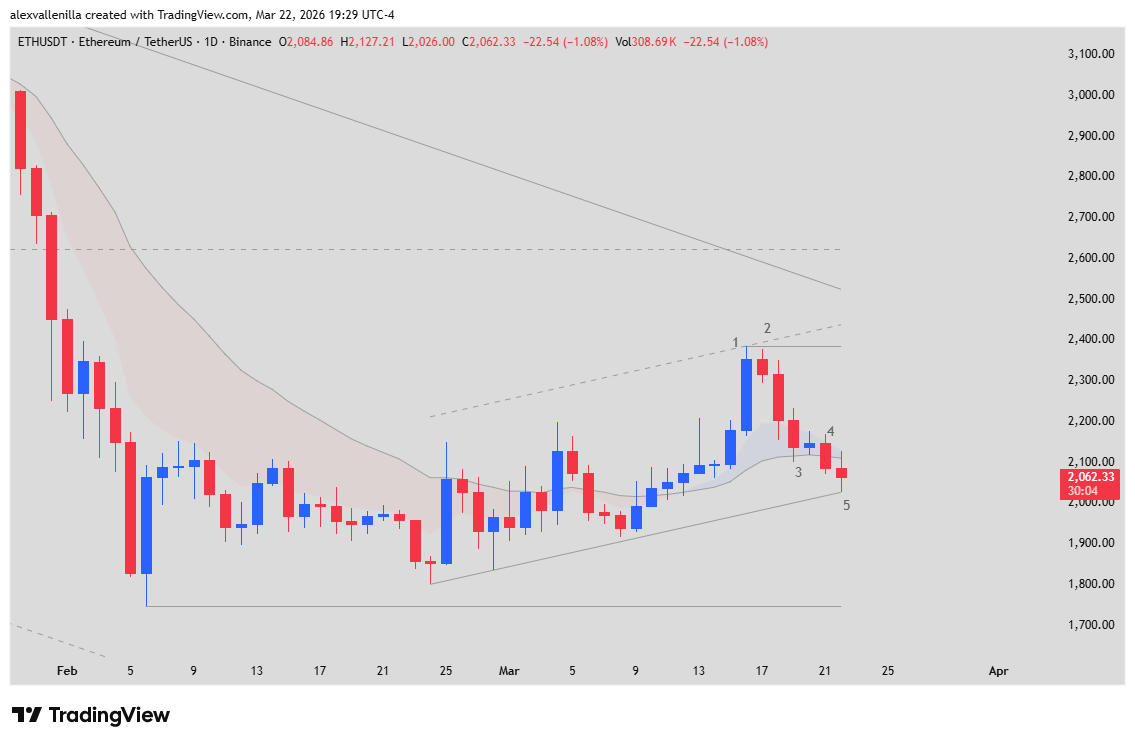
To understand what is happening with Ethereum’s price, it is imperative to analyze the narrative of its most recent daily candles, which reveal a pitched battle between supply and demand:
Bar 1 (The Climax): This candle marked a bullish milestone, reaching $2,386. However, it was identified as an EMA Gap Bar, opening and closing far from its moving average. It was a mirage—a climactic trap that exhausted buyers just before hitting the 166-bar primary downtrend.
Bar 2 (The Pause): A small-bodied doji that functioned as an inside bar. Momentum stalled here, initiating a technical “throwback” or reversal.
Bar 3 (The Signal): A bearish candle that validated a Low 2 setup. By marking lower lows, it triggered sell alarms by threatening the base of the minor ascending channel.
Bar 4 (Bear Dominance): Bears took total control of the micro-cycle, breaking the bodies of previous sessions and confirming the weakness of the rebound.
Bar 5 (The Moment of Truth): In the current session, the market shows total indecision. With a low recorded at $2,026, this bar is testing the lower trendline. It is a “struggle doji”; if it fails to bounce here, the fragile support could break.
Market Structure: A Minor Channel Under Siege
Despite the asset attempting to recover over the last 26 bars, the technical reality is that we are within a large-scale “bear flag.” The failure of buyers to even test the $2,623 resistance proves that sentiment remains defensive.
Currently, Ethereum‘s price reflects a -30.47% year-to-date (YTD) loss, maintaining a slim 5.11% gain on the year-over-year (1Y) comparison. Macroeconomic pressure on risk assets is weighing heavier than the network’s internal narrative.
Scenarios: Where is the Trend Headed?
Bearish Breakout: If Bar 5 or the following candle closes strongly below $2,000, the most likely scenario is a descent toward the horizontal support at $1,800, with a final technical stop at the previous low of $1,747.
Sideways Movement and Bounce: For a buy signal to emerge, the price must hold above the current minor channel and produce a strong reversal bar targeting $2,300 again, seeking to retest the exponential moving average.
Disclaimer: This analysis is for informational and educational purposes. Cryptocurrency trading involves high risk. It does not constitute financial advice.
Communications Professional. Crypto Enthusiast. Economic Journalist. Bitcoiner & Altcoiner.