

Bitcoin has reclaimed the $71,000 mark following a breather in Middle East tensions and a textbook technical setup that left sellers trapped.
The cryptocurrency market reacted with fierce optimism after President Donald Trump’s announcement regarding the postponement of military strikes, allowing risk assets to breathe. However, beyond geopolitics, the real magic is happening on the charts. After weeks of uncertainty, Bitcoin has executed a technical move known as a “Low 2 Failure,” invalidating sell signals and projecting targets that could challenge recent highs.
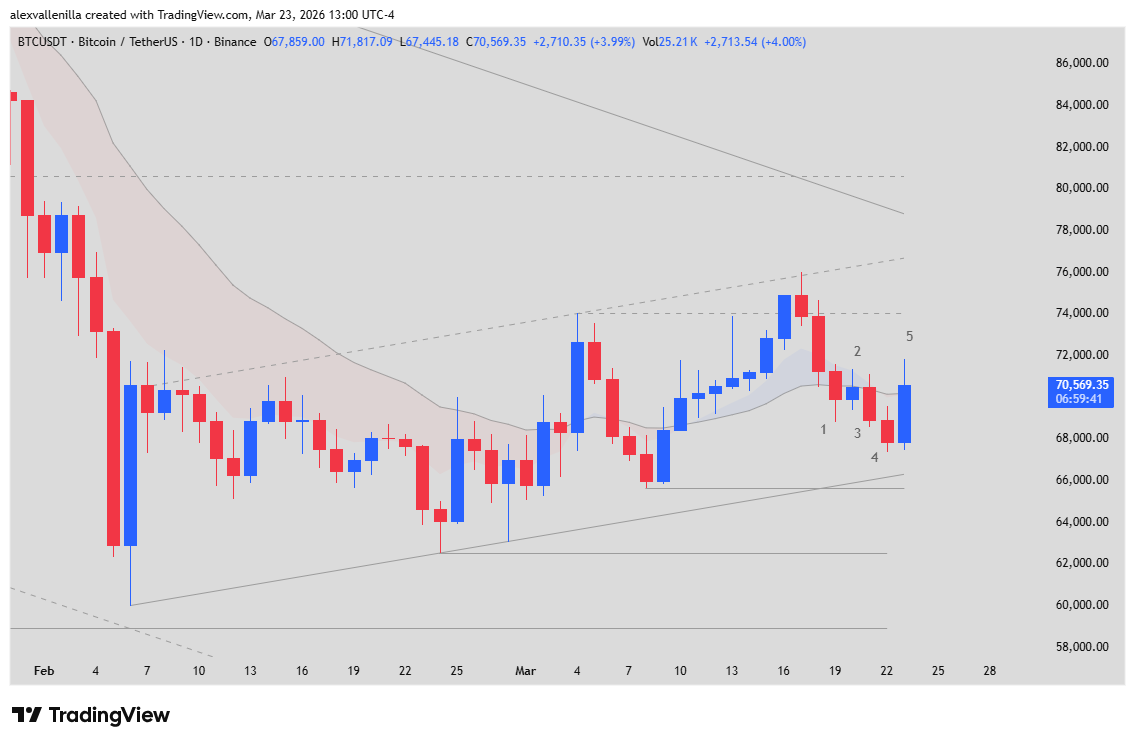
Technical Analysis: The Narrative of 5 Key Bars
Recent behavior on the 1D (daily) timeframe tells a story of capitulation and counterattack:
Bar 1: This bar formed a Low 2 sell setup following a two-bar drop after hitting the top of a minor ascending channel. It acted as a clear sell signal that attracted many bears, especially since the primary 168-bar trend remains bearish.
Bar 2: A small Doji of indecision. This inside bar halted the slide, proving sellers lacked the immediate strength to collapse the price. It represented an attempt to reverse the recent bearish micro-move within the channel.
Bar 3: Managed to trigger the sell signal by dropping below the Bar 1 low, attempting to continue the correction toward the channel base. It essentially acted as a failed reversal of the previous bar.
Bar 4: Bears tried to press further, but the price stalled at $65,600. By failing to test the lower trendline, the exhaustion of supply became evident.
Bar 5 (Current): The protagonist of the day. With a strong 4% bounce, the price sits at $70,602. By surpassing the high of Bar 1, it invalidated the sell signal, forcing sellers to cover their positions at a loss and accelerating the move up.
Market Structure and the Road to $77,500
Currently, Bitcoin remains within a 45-bar minor ascending channel acting as a potent counter-trend. The price precisely respected the $65,600 support, forming what experts call a Tweezer Bottom between bars 4 and 5.
The next major challenge is the “fire confluence zone.” If momentum holds, the immediate technical target lies between $74,000 and $76,600. However, the true critical level is $77,500, where the minor ascending channel’s resistance intersects with the 168-bar primary bearish trendline. Extreme volatility is expected upon reaching this point.
Projections
Sentiment has shifted from caution to tactical euphoria. With the breakout above the 20 EMA and the failure of previous sell signals, the path appears clear for a test of highs. However, investors should closely monitor the $76,800 zone, where reversal patterns could indicate that the counter-trend rally has reached its limit.
Disclaimer: This article is for informational and journalistic purposes only. It does not constitute financial advice or investment recommendations. Cryptocurrency trading involves high risk.
Communications Professional. Crypto Enthusiast. Economic Journalist. Bitcoiner & Altcoiner.