

The USDT Dominance (USDT.D) has entered a critical counter-trend phase after failing to overcome historical resistance levels. Technical analysis of the daily chart reveals the formation of a minor descending channel which, if confirmed, could inject the necessary liquidity for Bitcoin and the rest of the ecosystem to seek new local highs.
Technical Analysis: The Pulse of 10 Key Bars
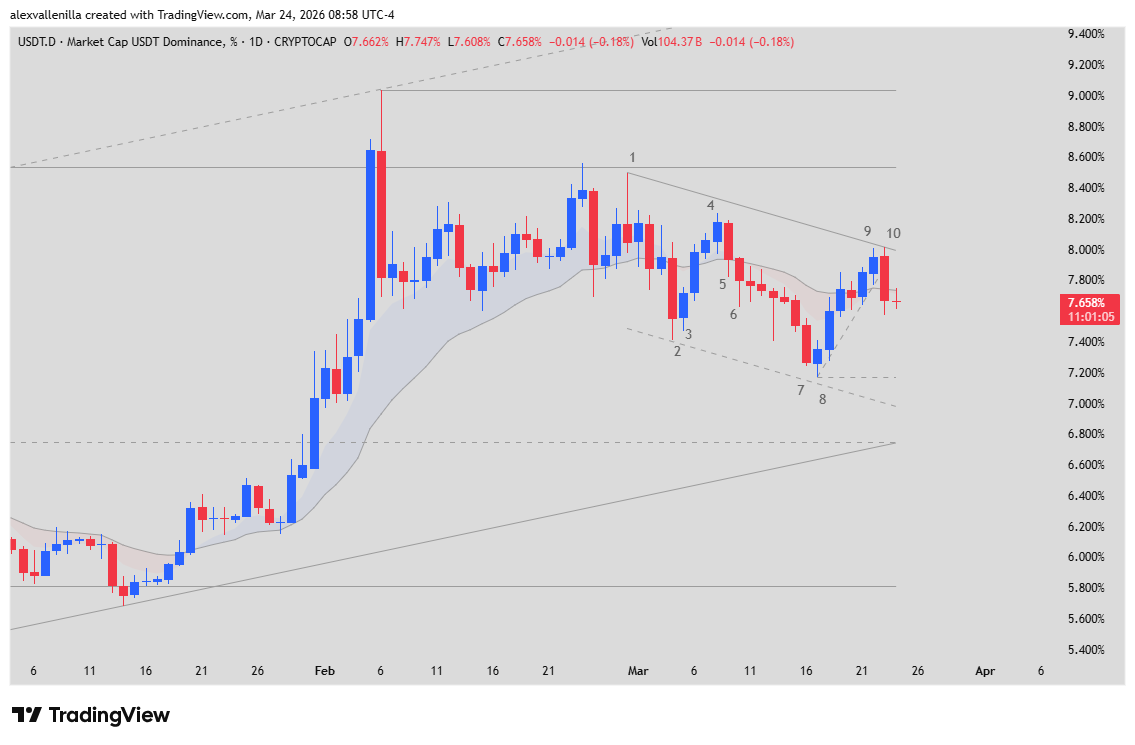
The recent behavior of USDT.D dominance summarizes an exhaustion battle where bears took temporary control of the chart:
Bar 1: Bears frustrated a second bullish attempt at the 8.53% resistance. This long-tailed pin bar marked a turning point in a rejection zone that has held firm for 1,013 bars.
Bar 2: A solid bearish trend candle that broke previous lows, establishing initial control of a new short-term minor descending channel.
Bar 3: An EMA Gap Bar that acted as a trap for bears, generating a short-lived bullish impulse. This type of bar remains valid within a 169-bar primary uptrend.
Bar 4: The rebound reached a lower high than Bar 1, confirming weakening demand.
Bar 5: A bearish candle initiating the reversal from the top of the 24-bar counter-trend channel.
Bar 6: Throwback confirmation. A Low 2 type bar that sent a clear sell signal despite defense at the lower wick.
Bar 7: A capitulation and acceleration candle with a strong-conviction close, marking a lower low than Bar 2.
Bar 8: An indecision doji that momentarily halted the slide, recording a new low at 7.16% and initiating a recovery attempt.
Bar 9: Pullback culmination. The price managed to reach a high above the 20 EMA, marking the end of this bullish retracement before bears regained control.
Bar 10: The definitive confirmation. A 3.47% bearish outside bar that engulfed the previous move. By closing below the 20 EMA and validating a lower high, it consolidates the counter-trend structure.
Market Structure and Upcoming Targets
Currently, USDT Dominance is navigating a 24-bar descending channel. The price appears to be heading strongly toward the 6.74% dynamic support, a level where the base of the major ascending channel and a 123-bar horizontal resistance (now acting as a floor) converge.
If the Bar 10 close is lost, we will likely see a new bearish “leg” seeking liquidity at 6.97%. This decline in stablecoin relevance usually translates into positive capital flow toward risk assets.
What to Expect for Bitcoin?
The confluence of supports in the 6.74% zone suggests extreme volatility is ahead. If USDT.D continues its descent, Bitcoin and altcoins could find the fuel needed to establish a solid floor and resume their upward path. Investors should closely watch this indicator, as its retreat is historically a “best friend” to crypto bull runs.
Disclaimer: This analysis is informational and does not constitute financial advice. Trading crypto-assets involves significant risks.
Communications Professional. Crypto Enthusiast. Economic Journalist. Bitcoiner & Altcoiner.