

In a scenario of extreme volatility, PAX Gold (PAXG) is staging a critical technical rebound, recovering toward the $4,570 zone after a correction that saw the digital metal test lows not seen in months. This move comes amid high-intensity geopolitical tension: as of March 25, 2026, Washington has funneled a 15-point ceasefire proposal through Pakistan and Egypt to Tehran. Meanwhile, the effective closure of the Strait of Hormuz—which handles 20% of global oil—and the liquidation of positions by regional petro-producers have forced a total reconfiguration of the risk map. With an annual return still holding an impressive 50%, despite a monthly drop of nearly 14%, PAXG stands at a crossroads between seller exhaustion and the need for a solid base.
The Geopolitical Board: Oil, Truces, and Liquidations
The gold market has stopped reacting linearly. While conflict historically drives safe-haven buying, the situation in the Strait of Hormuz has created a “liquidity trap” effect. Regional crude producers, facing massive export disruptions and surging physical oil costs (with Brent spiking past $112-$120), have been forced to liquidate gold positions to cover operational losses and margin calls. This explains the paradox of gold falling even as tensions escalated in early March following “Operation Epic Fury.”
However, the recent diplomatic stir—marked by President Trump’s confirmation of active negotiations and a 15-point plan covering sanctions relief and shipping guarantees—has allowed PAXG to breathe. The narrative of a potential “managed de-escalation” has reduced the immediate inflationary risk premium, letting digital gold stabilize.
Technical Analysis: Anatomy of the Post-Climax Rebound
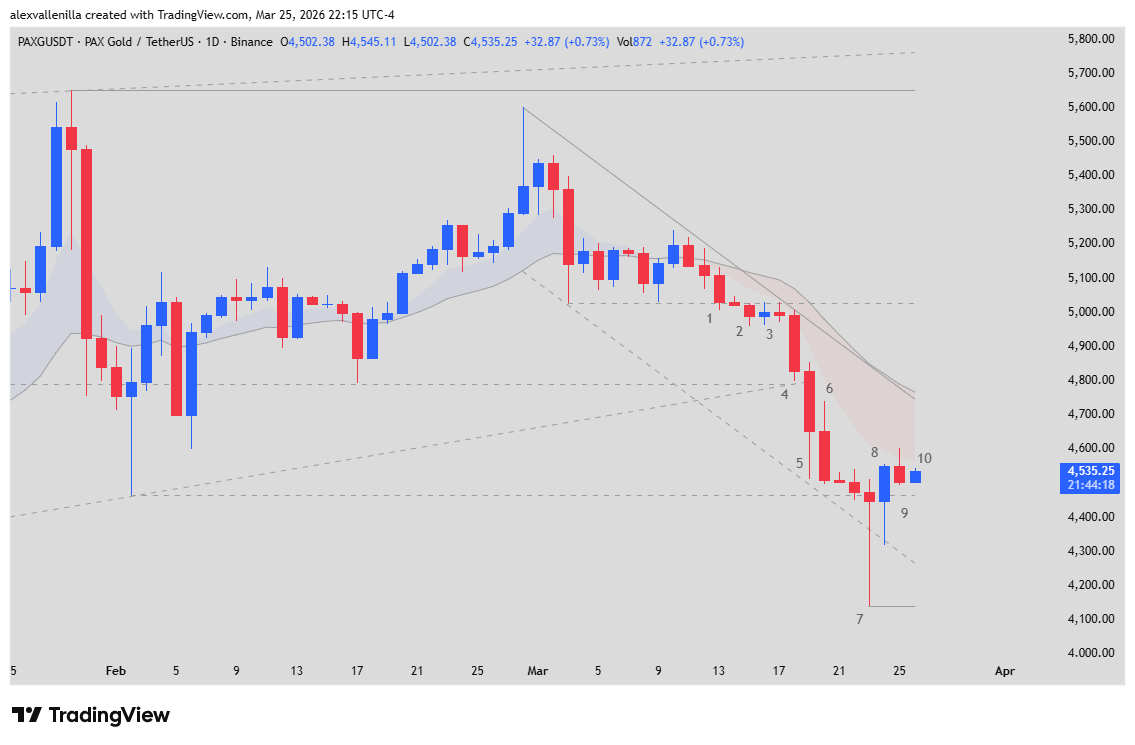
From a Price Action perspective, the PAXG chart presents a fascinating narrative of capitulation and absorption.
The Downward Cycle and Bar 7 (Sell Climax)
Bars 1 to 5 (The Spike): The market moved from a controlled micro-channel to total supply control. Bar 5 was a full-body bear bar that shattered psychological supports.
Bar 7 (EMA Gap Bar / Sell Vacuum): This is the “fingerprint” of institutional absorption. By drifting drastically away from the 20 EMA, it created a vacuum. The long lower wick indicates that “strong hands” stepped in at historical value zones (near $4,142), catching the falling knife.
The Transition: Bars 8 to 10
Bar 8 (Bull Reversal): A turning bar that halted the bleeding.
Bar 9 (Indecision): A Doji showing a temporary equilibrium between trapped bears and cautious bulls.
Bar 10 (Current Inside Bar): Price remains compressed. Trading above the 50% mark of Bar 5 suggests the $4,460 support (a former point of control) is being successfully defended.
Projection Scenarios and Trading Signals
The market is currently in a Trading Range phase following the climax. As of late March 2026, we project:
Lateral Scenario (60% Probability): Oscillation between $4,400 and $4,750. This is the healthiest path, allowing the 20 EMA to catch up to the price.
EMA Reversion (25% Probability): A solid close above $4,600 would magnetize the price toward the $4,850 resistance (Daily 20 EMA).
Support Failure (15% Probability): If Bar 10 breaks the Bar 9 low, PAXG could revisit the critical $4,140 floor.
Recommended Strategy: For aggressive profiles, entry sits above the Bar 8 high (~$4,580) with a Stop Loss at $4,350. Trend traders should wait for a test of the $4,750 – $4,850 zone to look for sell signals if a “Bear Signal Bar” appears near the resistance.
Building a Foundation
PAXG is proving to be a precise thermometer for modern geopolitics. While Bar 7 left an institutional buying footprint, the market still needs to digest the volume from regional liquidations. We do not expect an immediate vertical surge; the success of the bulls depends on turning $4,460 into a concrete floor.
Disclaimer: This analysis is for informational and educational purposes only. It does not constitute financial advice. Digital asset trading involves significant risks.
Communications Professional. Crypto Enthusiast. Economic Journalist. Bitcoiner & Altcoiner.