

The Stellar (XLM) ecosystem is at a technical tipping point that is capturing the attention of analysts and institutional traders. After a year of persistent bearish pressure that eroded 39% of its value, the asset has shown remarkable resilience in the last month, recording a 14% recovery. This move is not a coincidence; it responds to a market structure transition seeking to transform a prolonged bearish channel into a new regime of higher lows, placing the price in a critical decision zone between $0.1474 and $0.1861.
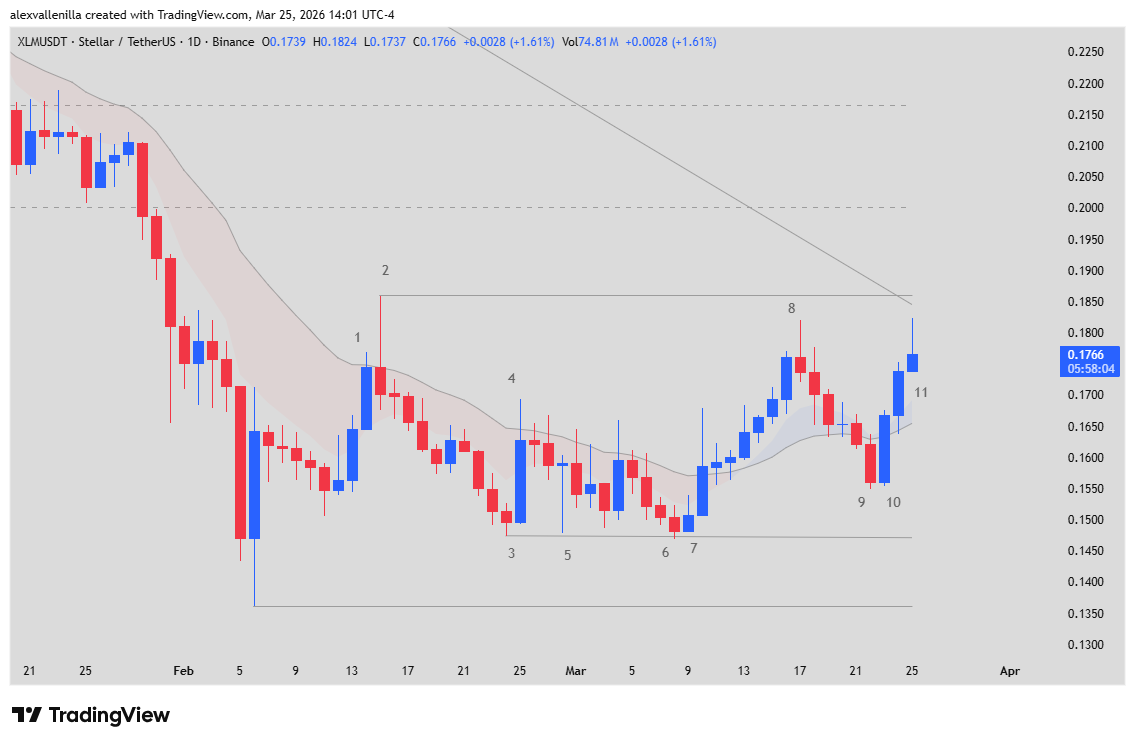
Chart Metamorphosis: From Tight Channel to Trading Range
For much of the past year, XLM was trapped in a “tight channel” structure, where the 20-period Exponential Moving Average (20 EMA) acted as an iron ceiling, rejecting every recovery attempt. However, the narrative has shifted. Currently, the price has entered a Trading Range, a phase of temporary equilibrium where bulls and bears are testing each other’s strength.
This phenomenon is the precursor to a potential Major Trend Reversal (MTR). The market is moving away from making lower lows and starting to build a solid foundation. The support at $0.1474 has been validated as a high-demand zone, while resistance at $0.1861 remains the final frontier before a major bullish expansion.
Price Action Analysis: The Bar-by-Bar Battle
To understand Stellar’s immediate future, we must break down the microstructure of its recent movements. The technical narrative is built through the interaction of supply and demand at key points:
Initial Phase and Traps (Bars 1 to 5)
Bar 1 marked a milestone: the First Gap Play, being the first close above the 20 EMA in a long time, signaling a shift in momentum. However, Bar 2 failed to break psychological levels, forcing the start of a lateral range. Although Bar 4 attempted an explosive move (Bull Surprise), the lack of continuity turned it into a trap for impatient buyers. Bar 5 established an implicit Higher Low, suggesting that the floor was rising.
Double Failure and Sell Capitulation (Bars 6 to 9)
The zone between Bar 6 and 7 is fundamental. Here we observe a “second breakout failure,” a high-probability signal in Price Action. Bar 7 functioned as a clear buy Signal Bar. Although Bars 8 and 9 brought a correction, Bar 9 (climactic in nature) failed to pierce the low of Bar 3. This failed “test” confirms that selling pressure is exhausting (Loss of Momentum).
Recovery and Compression (Bars 10 and 11)
Bar 10 is defined as a Bullish Engulfing, a candle that reclaimed the moving average with determination. Bar 11, though showing friction upon hitting the primary bearish trendline, maintains the higher-low structure. The price is now “compressed” between the 20 EMA and the major trend; historically, such compressions precede explosive movements.
Projected Scenarios: Where is the Price Heading?
Technical analysis suggests two main paths for the end of the quarter:
Bullish Scenario (60% probability): If the price achieves a daily close with a full body above the $0.1820 – $0.1860 zone, a Breakout would be confirmed. The technical target, based on the measured move of the range, projects toward $0.2010 – $0.2100. This would mark the end of a 250-bar downtrend.
Rejection Scenario (40% probability): A failure at the trendline could return the price to test the 20 EMA or the range base at $0.1500. However, as long as the low of Bar 9 ($0.1550) is held, the bullish thesis remains structurally intact.
The formation of increasingly higher lows indicates that investors are willing to accumulate XLM at rising prices, a classic symptom of institutional accumulation prior to a breakout. Stellar is in a stage of “clearing out” weak hands.
Disclaimer: This analysis is for purely informational and educational purposes. It does not constitute financial advice or an investment recommendation. Cryptocurrencies are high-volatility assets; only invest capital you are willing to lose.
Communications Professional. Crypto Enthusiast. Economic Journalist. Bitcoiner & Altcoiner.