

The bitcoin ecosystem is facing a high-tension session, marked by a disconnect between diplomatic efforts in Washington and the harsh operational reality of energy markets. While President Donald Trump attempts to project an image of imminent pacification in the Middle East through Pakistani mediation, the price of the leading cryptocurrency is retracing, signaling that investors aren’t fully buying the truce narrative. Persistent attacks on oil infrastructure in Russia and mixed signals from the Strait of Hormuz have reintroduced volatility to a chart that was struggling to consolidate a bullish breakout.
The Geopolitical Labyrinth: Oil vs. Bitcoin
The recent spike in crude prices, driven by uncertainty over Iran’s response to the 15-point peace proposal delivered by Islamabad, has triggered a liquidity drain toward energy hedge assets. Although Tehran allowed eight ultra-large crude carriers to pass through the Strait of Hormuz—a gesture that initially calmed nerves—reports of Ukrainian attacks on Russian refineries are keeping the risk premium elevated. For investors, bitcoin is currently moving more as a barometer of global stability than as an isolated asset.
Technical Analysis: Anatomy of a Local Capitulation
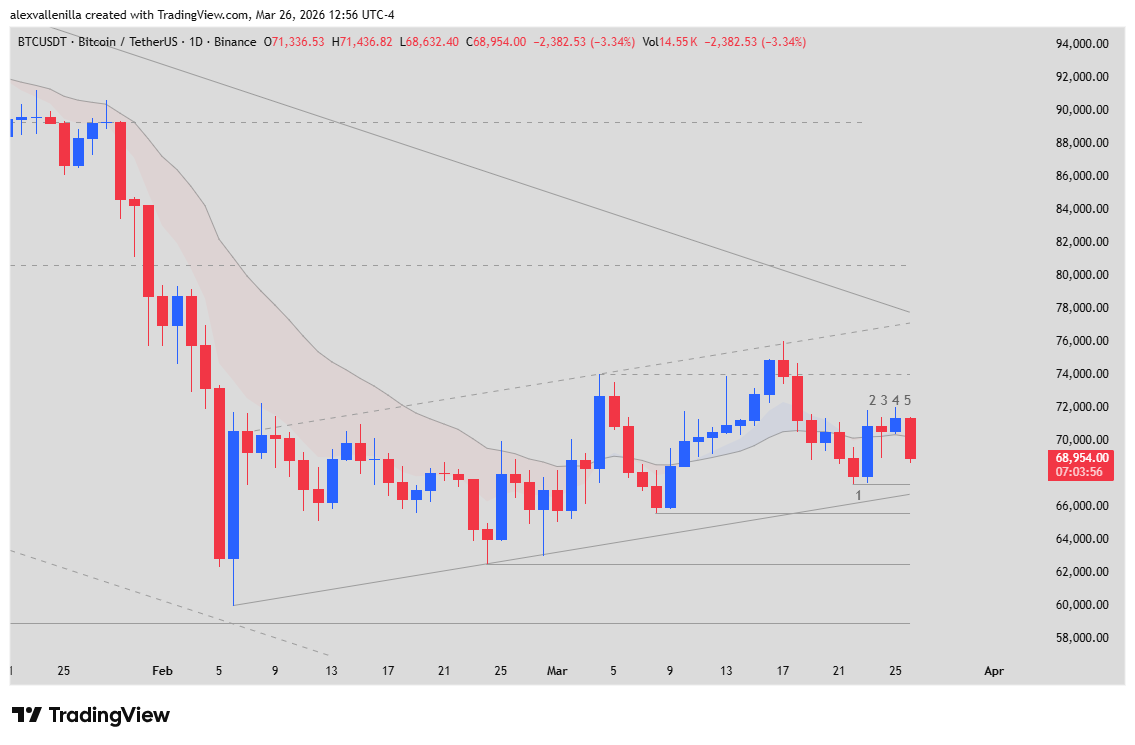
In terms of price action, bitcoin is at a critical crossroads. The market is trading within a Major Bear Channel (171 bars), where the recent Minor Bull Channel (48 bars) has begun to show cracks.
Bar-by-Bar Narrative:
Bar 1 (Support): We identify a fundamental Higher Low. The price’s inability to test the bottom of the major channel suggested, at the time, aggressive accumulation by “whales.”
Bar 2 (20 EMA Breakout): Acted as a Bull Surprise Bar. It was a Micro Double Bottom that catapulted the price above the 20-period moving average.
Bar 3 (Pinbar): A necessary pause. The lower wick confirmed absorption, but the lack of immediate follow-through began weaving the current “Barb Wire” structure.
Bar 4 (Pullback Failure): Activation of a High 1 (H1). Bulls attempted to regain control, but volume was insufficient to break the $77,800 confluence.
Bar 5 (Current – Bear Surprise): This is the key to the day. We are looking at an Outside Down Bar (engulfing) that invalidates the momentum of the previous two sessions. This isn’t just a pullback; it’s a sell-side urgency signal that places the probability of testing the $66,700 support at 60%.
Scenarios: Between $66,700 and Psychological Resistance
The close of Bar 5 near its lows suggests the market has opted for a Trading Range Price Action rather than a breakout. If the dynamic support of the minor channel at $66,700 gives way, the next technical target via Measured Move sits at $62,500. Conversely, only a total negation of Bar 5 within the next 24 hours would restore hope of seeing $77,000 in the short term.
Caution is the order of the day. With year-to-date losses of 21% and an anemic monthly gain of 6.5%, bitcoin remains a hostage to geopolitics and a technical structure that favors breakout failures.
Disclaimer: This analysis is strictly for informational and educational purposes. It does not constitute financial advice. Investing in crypto assets carries a high risk of capital loss.
Communications Professional. Crypto Enthusiast. Economic Journalist. Bitcoiner & Altcoiner.