

In a market that does not forgive complacency, Decred (DCR) finds itself at a technical crossroads after completing a 94-bar cycle within a robust Broad Bull Channel. Despite a 79% one-year (1Y) return and a solid 33% year-to-date (YTD) performance, the recent correction from the $37.40 highs has tested investors’ nerves. The key to the current price action lies in a fierce battle for support in the $20.00 – $21.00 zone, where supply and demand have paused their hostility to enter a phase of precarious equilibrium.
The Anatomy of a Correction: From Climax to Critical Support
DCR’s recent behavior is not random; it is a textbook lesson in price action. After reaching a buying climax that exhausted the bulls, the asset initiated a Bear Leg that sought liquidity at the lower levels of the major channel. This correction, though deep, served to flush out excess leverage and test the resilience of long-term holders.
Technical Analysis: The Narrative of the Bars
To understand where Decred is headed, we must dissect the micro-structure of the chart, identifying the mistakes of the “bulls” and the cunning of the “bears”:
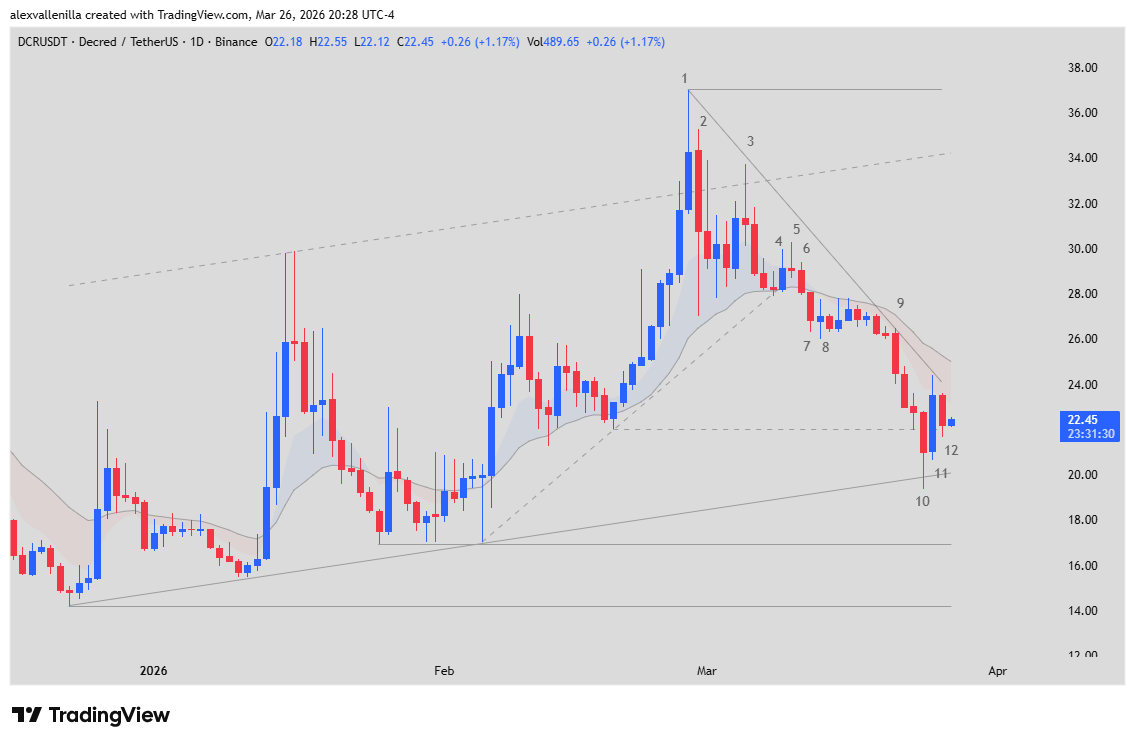
Bars 1 to 3 (Trap at the Highs): Bar 1 marked a violent Buy Climax. The breakout attempt failed quickly at Bar 2 (High 1 Failure), leaving buyers caught at the top (Trapped Bulls). Bar 3 confirmed that the test of the 20-period exponential moving average (EMA 20) would act as resistance rather than support.
Bars 4 and 5 (The Reversal Confirmation): While Bar 4 attempted to reclaim the EMA 20, Bar 5 (a bearish Pinbar) sealed the price’s fate by creating a Lower High. This Failure To Width was the exit signal for institutional traders.
Bars 6 to 8 (Bearish Dominance): The activation of a Low 2 setup at Bar 7 gave way to Bar 8, where selling pressure became sustained, breaking local support structures.
Bars 9 and 10 (Panic and the Vacuum): Bar 9 acted as a Bear Surprise, a sudden move that forced capitulation. Bar 10 represented the final Sell Climax, piercing support but recovering quickly in a Vacuum Test, proving there was insufficient selling interest below $20.00.
Bars 11 and 12 (Current State): Bar 11 is a Bull Surprise, a strong response indicating the presence of institutional buyers at the channel base. However, Bar 12 is a bearish Inside Bar, suggesting the market has entered a Tight Trading Range (TTR) while deciding its next direction.
Projected Scenarios: Where is the capital flowing?
The magnet effect of the EMA 20 continues to exert force on the price. Currently, DCR is “extended” to the downside, which technically suggests a mean reversion.
Scenario A (Accumulation – 60%): The most likely scenario following the strength of Bar 11. Price moves sideways between $21.00 and $24.00, forming a Double Bottom Higher Low. A breakout above $22.55 (the high of Bar 12) would activate a path toward $28.00.
Scenario B (Channel Breakout – 40%): If selling pressure invalidates Bar 11 and closes below $20.00, the 94-bar channel would be considered broken, opening the door to $16.94.
Market Close
Decred remains in a defensive phase but shows signs of early accumulation. Bar 11 shifted short-term market psychology, but patience will be the key virtue: until price manages to close above the micro-downtrend line and the EMA 20, the risk of a retest of support remains latent.
Disclaimer: This analysis is for informational and educational purposes only. It does not constitute financial advice. Crypto-asset investments carry a high risk of volatility. Conduct your own research before making investment decisions.
Communications Professional. Crypto Enthusiast. Economic Journalist. Bitcoiner & Altcoiner.