

The digital asset market is facing a high-tension session today. Bitcoin (BTC) has pierced critical support levels following confirmation of stalled peace negotiations in the Middle East, invalidating last week’s technical bounce. What began as relief over a potential ceasefire has transformed into a “bull trap,” driving the price below the 20-day Exponential Moving Average (EMA 20) and reactivating the long-term bearish structure.
The Geopolitical Factor: From Optimism to Sell-off
The market narrative shifted drastically over the last 48 hours. Following a brief period of de-escalation where price attempted to consolidate above $71,000, the lack of concrete agreements between the powers involved in the Middle East conflict has reintroduced risk aversion. Investors, who initially rotated capital into BTC seeking a “digital haven,” have begun liquidating positions in the face of oil strength and global inflationary uncertainty.
This fundamental scenario served as the perfect catalyst for the bearish technical structure—which had been brewing for 49 sessions—to finally boil over.
Technical Analysis: Anatomy of a Forecasted Breakout
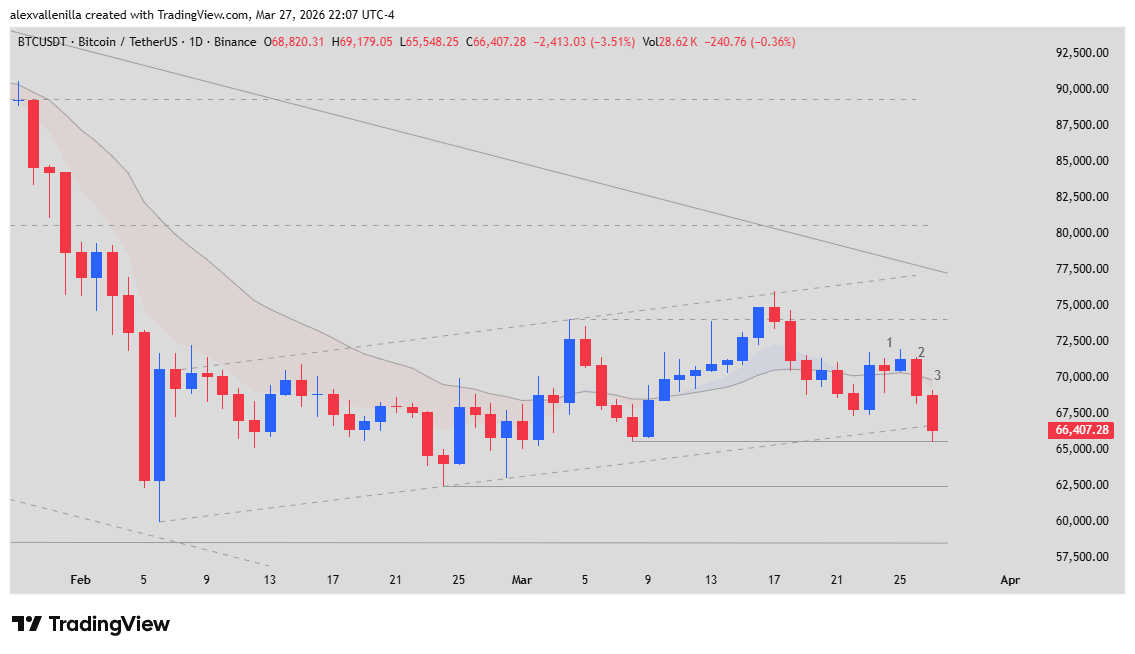
The BTC/USDT daily chart reveals a textbook technical transition: from a bullish counter-trend channel to the resumption of the major bearish momentum. Price action over the last three sessions (Bars 1, 2, and 3) is surgical for understanding institutional sentiment:
Bar Analysis and Price Action
Bar 1 (Exhaustion Doji): After testing the $72,000 zone, the market printed a small-bodied bar with a lower high. This signal was the first indication that bulls lacked the necessary conviction to challenge the major descending channel resistance. The close far from the previous day’s highs confirmed that institutional buying flow had dried up.
Bar 2 (Bear Surprise / Entry Bar): This is the key reversal bar. A solid bearish body that closed in its lower third, successfully piercing the EMA 20. Technically, this generated an “EMA Gap,” a sign of weakness where price not only loses the average but attracts sellers waiting for a Low 2 Setup.
Bar 3 (High-Conviction Breakout): Final validation arrived with this Big Bear Bar. It is not only a wide-range bar but represents the formal breakout of the short-term bullish channel (Bear Flag). With minimal tails, it demonstrates that “bears” dominated the order flow from open to close, triggering a cascade of liquidations below $67,500. Bar 3 serves as a Low 2 sell setup bar.
Critical Levels and Projections
The break of the $65,620 support marks the start of a new corrective phase. The immediate technical target is situated at the base of the previous channel near $62,500, with a probable extension toward the $60,000 psychological level if geopolitical tensions do not subside.
Resilience Put to the Test
The loss of the EMA 20 and the confirmation of the Low 2 suggest that any recovery attempt will be sold into in the short term. Bitcoin is once again behaving as a risk asset sensitive to global liquidity, reminding us that in times of war, technicals usually follow geopolitics.
Disclaimer: This article is for informational and educational purposes only. It does not constitute financial advice or investment recommendations. Trading crypto assets involves a high risk of capital loss.
Communications Professional. Crypto Enthusiast. Economic Journalist. Bitcoiner & Altcoiner.