

In an unexpected twist for the 2026 bearish narrative, Shiba Inu (SHIB) has begun showing signs of a solid accumulation phase following a period of extreme capitulation. While the asset still carries a 13% YTD depreciation and is down 53% over the past year, on-chain data reveals a changing of the guard: between 112 billion and 125 billion SHIB tokens have left exchanges in the last 24 hours, moving into cold storage wallets. This drain of sell-side liquidity, combined with spot buy volume exceeding sell volume by 27.4 billion units, suggests that institutional investors and “whales” are establishing a psychological floor while the Shibarium ecosystem continues its operational maturation.
From Freefall to Trading Range: Structural Analysis
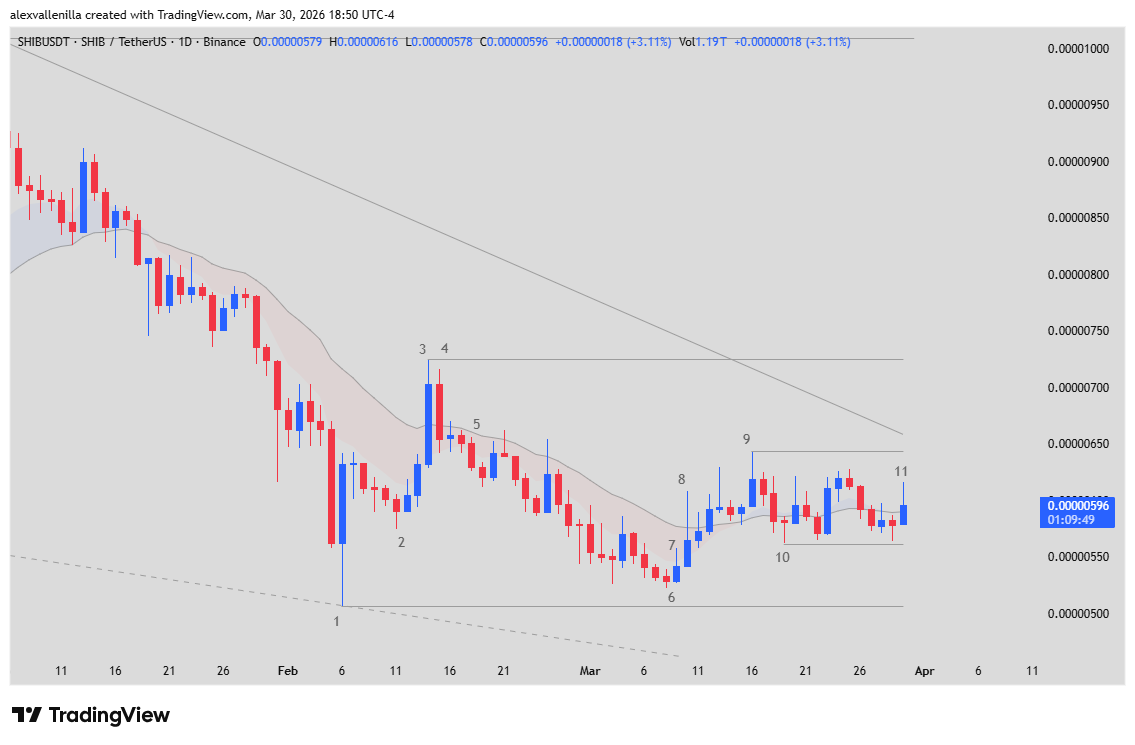
Until recently, the SHIB macro outlook was a textbook Broad Bear Channel. However, the dynamics are mutating. We have moved from an aggressive series of lower highs and lower lows to a compression structure, similar to an ascending triangle or a sideways wedge.
A fundamental technical milestone is the price relationship with the 20-period EMA (Exponential Moving Average). What previously acted as a concrete ceiling is now being frequently pierced, invalidating bearish momentum and suggesting the market is in “wait and see” mode.
Price X-Ray: The 11-Bar Map
To understand where we are headed, we must break down the recent technical narrative based on price action:
Bar 1 (Capitulation): Represents the selling climax. It is a reversal bar with a prominent lower tail marking critical support at $0.00000507. Panic set in here, but so did institutional money.
Bar 3 (The Bull Surprise): This is the inflection point. By closing above the 20 EMA for the first time in 28 sessions, the bias shifted from “sell every bounce” to a potential sideways range.
Bar 5 (Bear Trap): Functioned as a Low 2 setup, a bear attempt to regain control that caused the price to dip again.
Bar 6 (Higher Low): Although it is a small bearish candle, its importance lies in the fact that the low is higher than Bar 1, confirming the loss of selling momentum.
Bar 10 (Relay Pinbar): A perfect test of the value zone. Support was firmly established at $0.00000562, a level we now define as the line in the sand for bulls.
Bar 11 (Final Compression): An indecision candle pressing against the upper trendline of the channel. Volatility has dropped drastically, which is usually the prelude to an explosive move or breakout.
Technical Analysis: Breakout or Rejection?
The top priority right now is volatility compression. We observe a succession of higher lows (Bar 1 -> Bar 6 -> Bar 10), indicating that buyers are willing to step in at increasingly higher levels.
Projected Scenarios
Bullish Scenario: If SHIB manages to break the Bar 9 resistance ($0.00000644) with a solid-body candle and volume, the immediate technical target is the Bar 3 high ($0.00000725), with a view toward testing $0.00000850 in the medium term.
Bearish Scenario: A violent rejection at the current trendline (Bar 11) would invalidate the structure if the price falls below the Bar 10 support. This would force a retest of the panic lows in the $0.00000507 zone.
A Market in Precarious Equilibrium
The massive outflow of tokens from exchanges acts as a silent catalyst; there is less SHIB available to sell, which facilitates a rally if Shibarium demand or general crypto market sentiment remains positive. We are 3 to 5 daily bars away from a clear definition.
Disclaimer: This analysis is for informational purposes only and does not constitute financial advice. Investments in crypto assets carry high risk. Conduct your own research before trading.
Communications Professional. Crypto Enthusiast. Economic Journalist. Bitcoiner & Altcoiner.