

Against a backdrop defined by escalating conflict in the Middle East that catapulted crude oil above $100, bitcoin is facing its most severe trial since the start of the bull cycle. The involvement of powers such as the U.S., Israel, and Iran injected global inflationary fears that, paradoxically, stemmed the cryptocurrency’s bleeding in March, triggering an unprecedented capital rotation from gold toward the blockchain ecosystem. Despite losing key technical levels, bitcoin is beginning to act as a value buffer against the sharp decline of precious metals.
Geopolitics and Oil: The New Volatility Catalyst
The crisis in the Middle East has reconfigured the financial landscape. With oil breaching the $100 barrier, the specter of persistent inflation forced investors to liquidate risk assets. However, the disruptive data point at this quarter’s close is gold’s weakness. While the precious metal corrected violently from all-time highs, bitcoin found an equilibrium zone between $60,000 and $65,000, suggesting that institutional players may be executing a portfolio rotation into assets with greater mobility and programmed scarcity.
Technical Analysis: The Battle for the 20 EMA and Bear Dominance
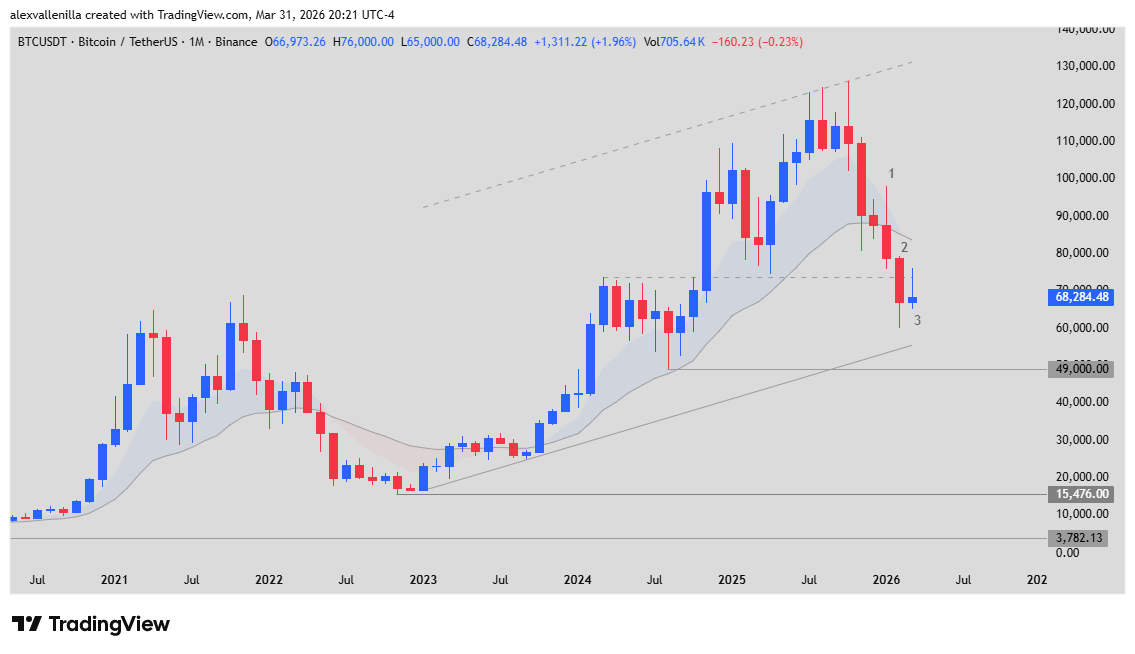
After hitting the top of the ascending channel near $130,000, the market structure transitioned from a Strong Bull Trend to a complex correction phase that threatens the long-term bullish narrative.
Bar Analysis (Price Action)
BAR 1 (Bear Surprise Bar): This Outside Bar marked the inflection point. It was a violent breakout from the bullish micro-structure. The prominent upper wick reveals a failed Top Reversal: bulls attempted to defend all-time highs but were crushed by massive selling pressure, closing below the monthly 20 EMA.
BAR 2 (Bear Follow-through Bar): Confirmation of the bearish bias. The close near the bar’s lows and below the $73,800 psychological support validates that this is not simple profit-taking, but institutional capitulation. The remaining “room” down to the lower trendline suggests bears still have maneuvering space.
BAR 3 (Inside Bar / Potential EMA Gap Bar): The current bar acts as a pause. By keeping its high below the 20 EMA, it sets up as a Moving Average Gap Bar. However, its stagnation in the “market memory” zone ($60k–$65k) indicates a temporary balance. This bar also shows signs of bear exhaustion.
Order Flow and Critical Levels
Current selling pressure is the strongest recorded since 2023. Losing the 20 EMA transformed this indicator—previously dynamic support—into resistance that will likely be tested and sold in the short term.
Alert Signal: A break below the low of Bar 3 would trigger a continuation scenario toward the channel base at $55,400. Conversely, only a close above the high of this bar would offer a reprieve to retest the moving average.
Where Is the Market Heading?
We are witnessing a technical paradigm shift. Although the rotation from gold favors the narrative of bitcoin as a store of value, price must reclaim the 20 EMA to invalidate the current bearish structure. For now, bears remain in control, and lateralization appears to be the most likely scenario before the next major move is defined.
Disclaimer: This analysis is for informational and educational purposes only. It does not constitute financial advice or investment recommendations. Cryptocurrencies are high-volatility assets; only invest capital you are willing to lose.
Communications Professional. Crypto Enthusiast. Economic Journalist. Bitcoiner & Altcoiner.