

The digital asset market is breathing a sigh of relief. After months of uncertainty, the apparent cooling of tensions in the Persian Gulf has restored investors’ risk appetite. In this context, Algorand (ALGO) is emerging from a prolonged slumber, posting a 20% gain over the last month and triggering technical breakout signals not seen in quarters. Despite carrying a 43% annual loss, the formation of a solid accumulation base suggests that “smart money” is taking positions.
ALGO’s Metamorphosis: From Crypto Winter to the Breakout Zone
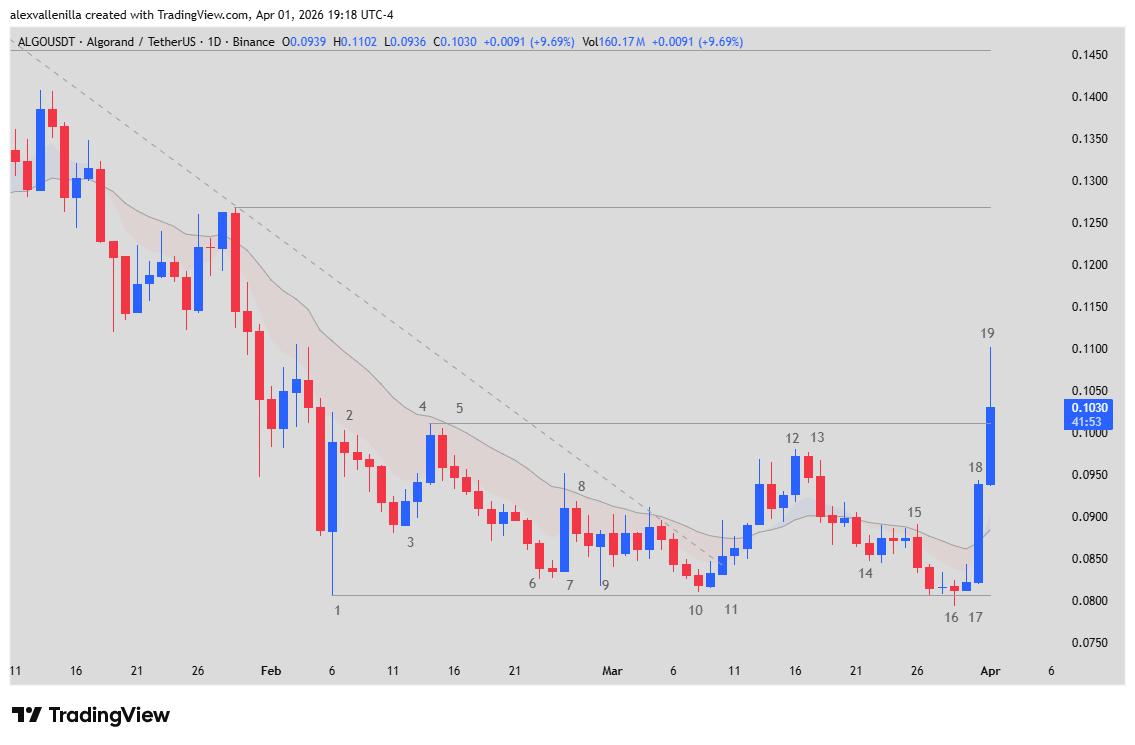
To understand Algorand’s current movement, looking at the rearview mirror is imperative. The cryptocurrency navigated a long-term bearish channel that led it to extreme oversold levels. However, data from February and March 2026 reveal an Accumulation Base structure.
Price moved from a vertical negative trend phase to a sideways Trading Range, bounded by critical support at $0.0807 and technical resistance in the $0.1022 – $0.1030 area. This behavior is typical of market cycles where supply dries up and demand begins to absorb available inventory. Although ALGO is still down 6.70% year-to-date (YTD), recent momentum indicates a shift in institutional sentiment.
Technical Analysis: The Anatomy of a Market Structure Shift
The current chart offers a masterclass in price action. Below, we break down the technical narrative using bar numbering:
The End of Bearish Dominance (Bars 1 to 11)
Bar 1: Identified as a Selling Climax. Seller capitulation left a liquidity trail that took the market weeks to process.
Bar 7: Marks a fundamental milestone. It is the first touch of the 20 EMA after a long period of divergence. Technically, this “Bar Gap” initially attracted sellers (Bar 8), but sowed doubt regarding the bears’ strength.
Bar 11: The inflection point. This is where the breakout of the major bearish trendline occurs, transitioning the market from “Bearish” to “Neutral/Sideways.”
The Trap and Acceleration (Bars 16 to 19)
Bar 16 (Bear Trap): Sellers attempted to regain control with a Bear Surprise, piercing the support of Bar 1. However, the close with a long lower wick revealed that institutional demand was waiting at those levels.
Bar 18: An expansive body Bull Trend Bar (nearly double the size of previous bars). This move acts as a Breakout Gap, trapping traders looking for short positions.
Bar 19 (Current): Price is actively piercing the $0.1022 resistance (the high of Bar 4). This is the catalyst for a Market Structure Shift.
Projections and Targets
If Bar 19 maintains its strength at the close, the most likely scenario is the search for a second leg up (Leg 2). The initial technical target, calculated by projecting the range height ($0.0215), sits at $0.1237, with an extended resistance zone at $0.1269. A close above this level would open the doors toward $0.1456.
Paradigm Shift or False Dawn?
Algorand is demonstrating remarkable technical resilience, driven by a more favorable macroeconomic environment. The transition from a sideways range to a Bull Breakout suggests that the accumulation phase has ended. Nonetheless, to confirm this trend reversal, ALGO must flip the old $0.1022 resistance into solid support during the next pullback.
Disclaimer: This analysis is for informational and educational purposes only. It does not constitute financial advice or an investment recommendation. Cryptocurrencies are high-volatility assets; only invest capital you are willing to lose.
Communications Professional. Crypto Enthusiast. Economic Journalist. Bitcoiner & Altcoiner.