

The cryptocurrency market faces a volatile session. Following President Donald Trump’s recent speech confirming the continued blockade of the Strait of Hormuz, bitcoin reacted with a significant technical correction. Uncertainty transformed what appeared to be a healthy consolidation into a fierce struggle to defend critical support levels. Meanwhile, Brent crude prices are skyrocketing as investors flee toward liquidity amid fears of a global energy crisis.
The Speech That Shifted Sentiment: Geopolitics and Energy
Last night, President Trump provided an update on the conflict in the Gulf. Although military forces are nearing their objectives, the President ensured that the closure of the Strait of Hormuz—the artery carrying 20% of the world’s oil—will continue for several weeks.
This statement triggered an immediate domino effect: oil surged violently, while risk assets, including cryptocurrencies, suffered massive capital outflows. At the time of this report, bitcoin trades at $66,315.00, reflecting a 2.67% intraday drop. These events challenge the “digital gold” narrative, as BTC maintains a tight correlation with tech indices, which are also succumbing to macroeconomic pressure.
Technical Analysis: Bears Dominate the “Tight Trading Range”
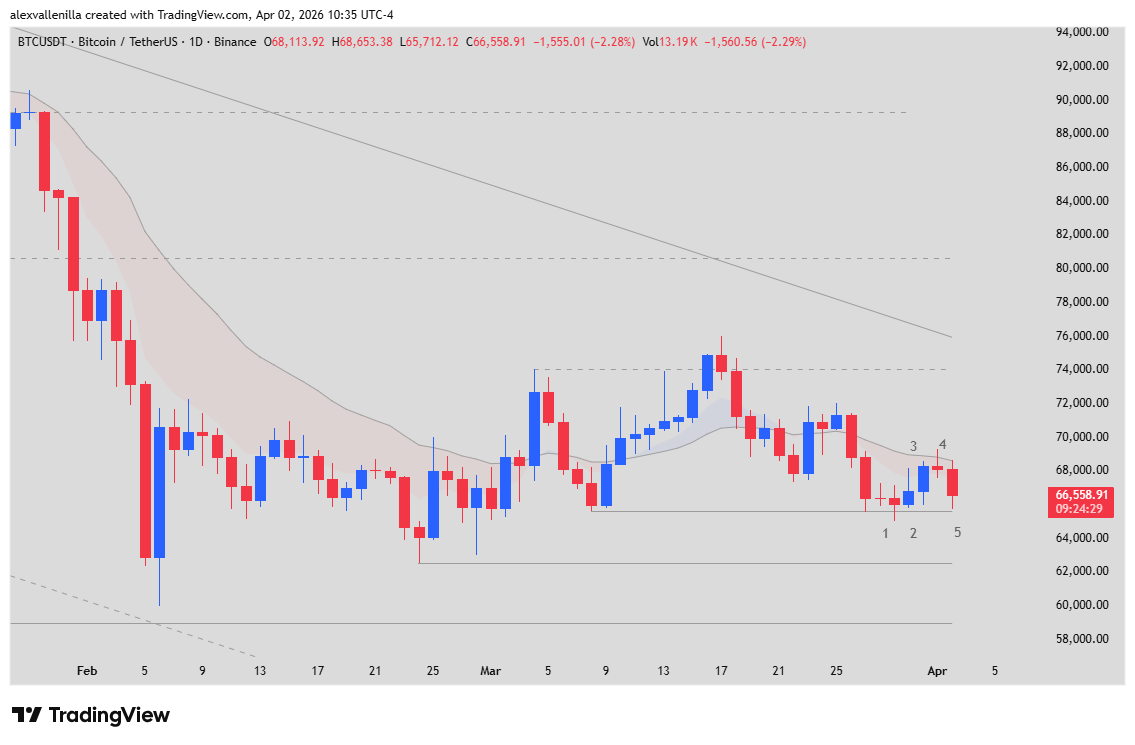
The bitcoin daily chart shows a Major Bear Trend within a 178-bar channel. Currently, price is stalling in a 30-day trading range acting as a large-scale bear flag. The 20 EMA (Exponential Moving Average) exerts constant pressure, crushing price against horizontal support.
Bar-by-Bar Technical Narrative
Price action over the last five sessions tells a story of buyer exhaustion:
Bar 1 (Bear Doji): The market paused its decline. The rejection at $65,600 proved that institutions are still executing buy orders in that zone to stall the crash.
Bar 2 (Bullish Pin Bar): Buyers attempted a pullback. However, the upper wick confirmed that sellers are closely monitoring higher levels to enter with force.
Bar 3 (Weak Continuity): This bullish candle failed to break above the 20 EMA or previous highs. Bulls lost momentum exactly when the market required conviction.
Bar 4 (Reversal Doji): Here, bears regained control. After the failed moving average breakout, this candle became the definitive Signal Bar.
Bar 5 (Current Bar – Entry Bar): This bar validates the previous signal. The solid candle body consumes nearly all the gains from previous days and strikes directly at the $65,600 support.
The close of Bar 5 will dictate the short-term sentence. If price pierces $65,600, bitcoin will trigger a massive liquidation of long positions, targeting $62,500 or even the $60,000 psychological level.
The Path of Least Resistance
Geopolitical tension and the systematic rejection at the 20 EMA suggest that bitcoin is heading toward lower levels. A break of the current support will serve as the trigger for the final capitulation of the range. Only a strong close above the moving average would provide relief to the markets.
Disclaimer: This article is for informational purposes only. It does not constitute financial or investment advice. Trading digital assets involves risks of capital loss.
Communications Professional. Crypto Enthusiast. Economic Journalist. Bitcoiner & Altcoiner.