

The VSN/USD pair completed a textbook structural transition on its daily chart, marking the end of a 198-bar downtrend. Following a selling climax and a sideways accumulation phase, the bullish breakout confirmed over the last 48 hours positions Vision (VSN) as a top asset to watch. The move, driven by regulatory clarity and the Bitpanda ecosystem, aims to reverse annual losses of 53.6% through a major trend reversal that caught sellers in a technical trap.
From “Barb Wire” to Breakout: Chronicle of a Recovery
The digital asset ecosystem is witnessing VSN’s struggle to find a solid floor after a complicated fiscal year, with the token still carrying a -32.72% YTD performance. However, the narrative shifted radically at the end of Q1 2026.
The structure transitioned from a capitulation phase to a low-volatility trading range. For weeks, price remained trapped in a formation known as Barb Wire, where overlapping bars reflected absolute indecision. This extreme compression is usually the prelude to violent directional moves, and the market finally chose its path: upward.
Technical Analysis: Price Action Breakdown
To understand the potential of this move, we must break down the technical narrative bar-by-bar, identifying the milestones that validate the shift in sentiment.
Phase 1: Capitulation and Support Test
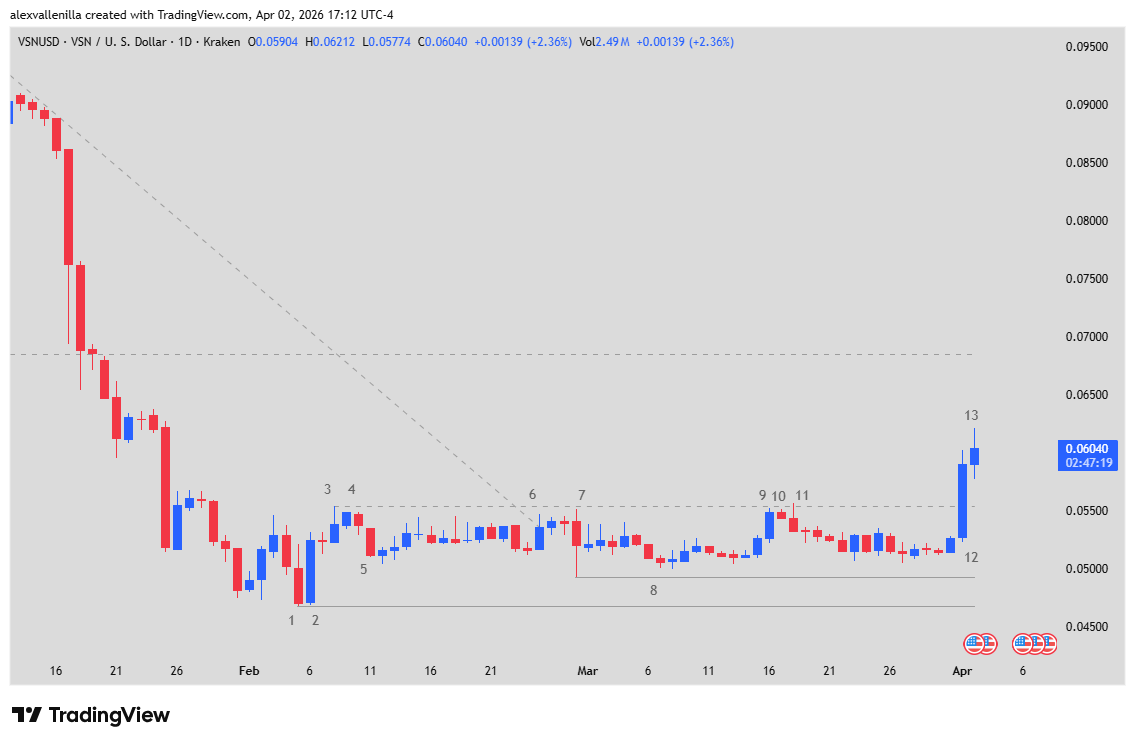
Bars 1 and 2: Bar 1 represented the Selling Climax. Immediately, Bar 2 emerged as a Bull Surprise, injecting optimism and defining a temporary floor.
Bar 5: This small-bodied bar confirmed the market wasn’t ready for a “V-shaped” recovery, forcing price into a sideways range to absorb remaining supply.
Bar 7: A crucial milestone. This Outside Bar functioned as a supply test. By closing above the Bar 1 low, it validated a Higher Low, the first signal that buyers were taking control.
Phase 2: The Trap and the Breakout
Bars 8 to 11 (Barb Wire): Price entered a noise zone. Bar 11 was a Bear Trap; a bearish bar that failed to produce selling follow-through, leaving short sellers trapped.
Bar 12 (Bull Breakout): This is the high-conviction bar. With a wide body and a close near its high, it broke the $0.0554 resistance (previously established by Bar 3).
Bar 13 (Confirmation): By exceeding the previous bar’s high, it validates follow-through. The market accepted the new price levels, absorbing liquidity in the resistance zone.
Trading Strategy (Set-up)
We are looking at a Major Trend Reversal (MTR). The official buy signal triggered after the Bar 12 close.
Logical Entry: Between $0.0555 and $0.0560.
Stop Loss (SL): Below $0.0518 (the low of the breakout bar).
Targets: The first resistance level sits at $0.0685. If momentum holds, the technical target via range projection points to $0.0750 – $0.0800.
The MiCA Factor and Real Utility
The 15.18% recovery over the last month is no coincidence. While technical analysis shows a bullish structure, the fundamentals are backed by Vision Chain, the Ethereum Layer 2 designed for Real World Asset (RWA) tokenization under MiCA regulations. VSN is not just a speculative token; it is the fuel for European institutional infrastructure. If price manages to reclaim the $0.0969 zone, we would be looking at a full cycle reversal.
| What is Vision (VSN)? |
|---|
| Vision is the utility token for Bitpanda that powers Vision Chain, an Ethereum L2 focused on regulated institutional finance. It provides access to staking rewards (~10% APY), deflationary governance through quarterly burns, and is the cornerstone for tokenizing bonds and real estate in Europe. |
Disclaimer: The information contained in this article is for informational purposes only and does not constitute financial advice. Investments in crypto-assets carry high risk. Conduct your own research before trading.
Communications Professional. Crypto Enthusiast. Economic Journalist. Bitcoiner & Altcoiner.