

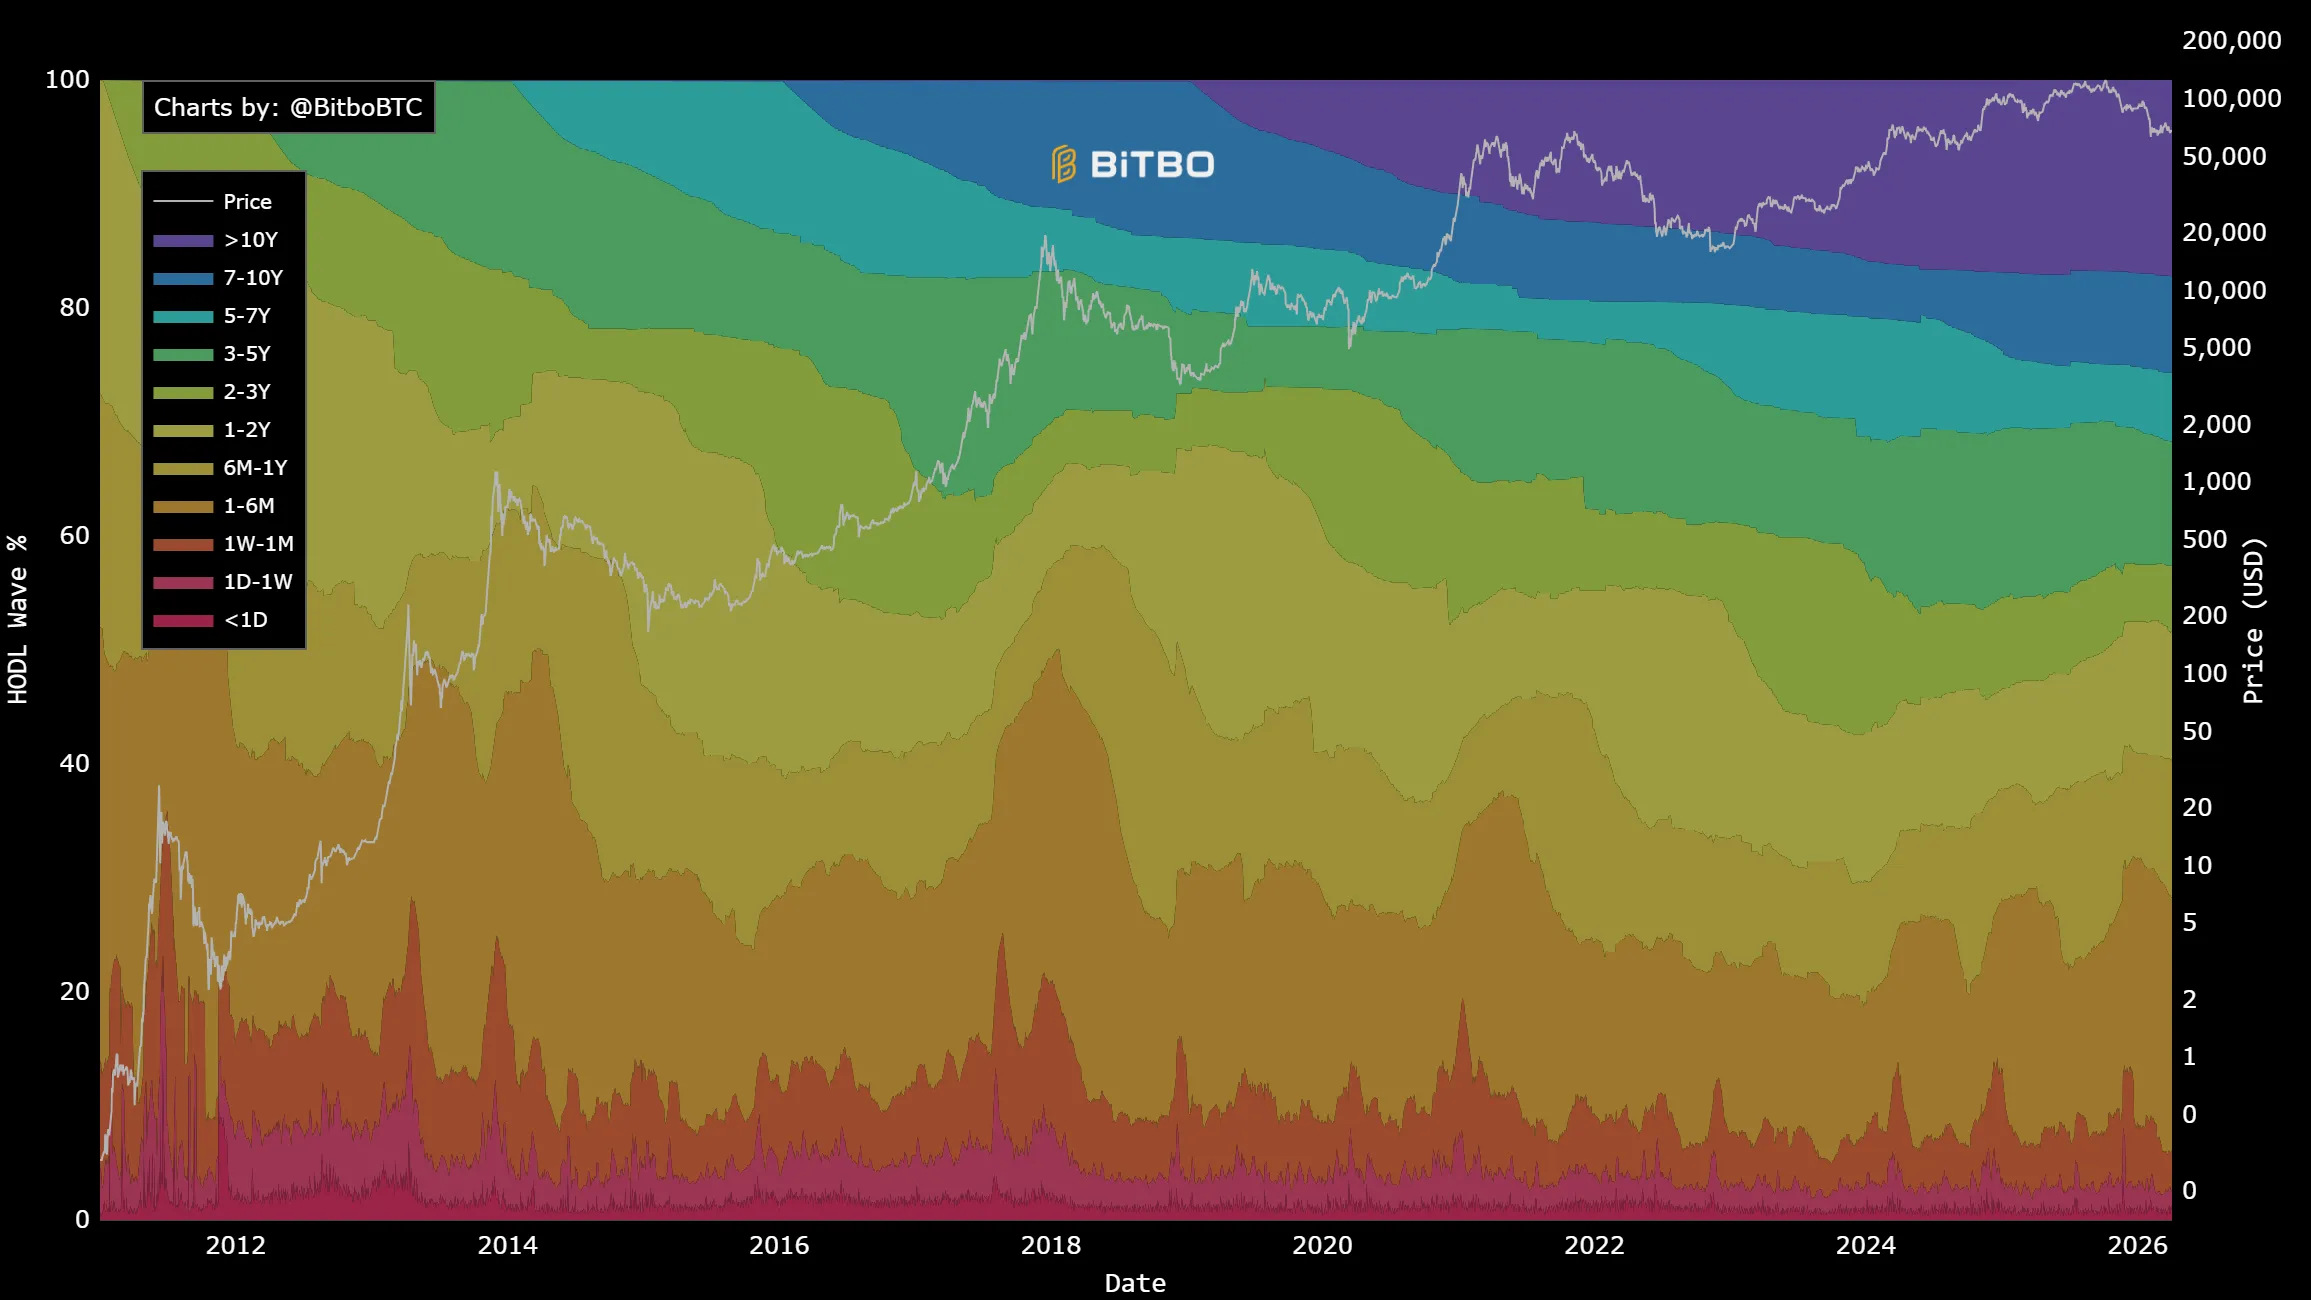
The Bitcoin ecosystem is witnessing an unprecedented accumulation phenomenon. According to the latest data from Bitbo, long-term investors—those who have held their assets for over a decade—pushed the 10Y+ HODL Wave indicator to an all-time high of 17.3%, while the bitcoin price sits at $66,857.99. This movement suggests an unwavering conviction that redefines the asset’s scarcity narrative.
All-Time Highs in the Oldest Cohorts
Capital maturation within the Bitcoin network is evident. For the first time in history, the 10Y+ HODL Wave indicator reached the 17.3% mark, surpassing the previous record of 17.1% set on June 21, 2025.
What does this mean? Essentially, a significant portion of the total bitcoin supply has not moved in at least ten years. These are the true believers or lost wallets acting as a supply anchor, reducing available liquidity on exchanges and putting upward pressure on the price over the long term.
Meanwhile, the 7Y+ HODL Wave also shattered glass ceilings, hitting 25.7% for the first time. This indicator beat its previous high of 25.1%, confirming that those who bought before or during the 2017 cycle have no intention of liquidating their positions in the short term.
The Recovery of Mid-Cycle Investors
The behavior of the 5, 3, and 2-year cohorts tells a story of resilience following profit-taking:
5Y+ HODL Wave: Returned to its all-time high of 31.7%. This is a notable recovery, considering that after March 10, 2024 (when bitcoin traded at $61,259.00), the indicator dropped to a low of 30% in September 2025, just as the price climbed to $122,501.00.
3Y+ HODL Wave: Currently at 42.6%. Although it stopped bleeding after hitting lows of 42.4% in November 2025, it remains far from its 46.8% peak seen in May 2024.
2Y+ HODL Wave: After bottoming out at 47.4% in late 2025 with a price of $87,606.00, it shows a slight recovery, reaching 48.4%.
The Bound of One-Year “Graduates”
The 1Y+ HODL Wave, which measures coins that haven’t moved in at least 12 months, stands at 59.7. This indicator is crucial because it shows a bounce from the 58.4 low recorded in December 2025, when the price was $92,111.00.
Historically, this group tended to capitulate or sell during the rally toward $122,000.00, but the fact that the indicator is climbing again suggests a new base of investors is starting to “HODL” seriously following the volatility of the last two years.
Where Are We Headed?
Bitcoin data reveals a robust market structure. While price fluctuates, the long-term holder (HODLer) base strengthens. The decline in the 1 to 3-year waves during the surge to all-time highs above $122,000.00 confirms that the market was driven by a wealth transfer from old hands to new hands.
However, the fact that all HODL wave metrics (from 1 year to 10 years) are currently in a recovery phase or at all-time highs indicates that a “supply shock” is imminent. If institutional demand continues and current holders refuse to sell, the path of least resistance for bitcoin remains upward.
Disclaimer: This content is for informational and educational purposes only. It does not constitute financial advice or an investment recommendation. Digital assets are highly volatile; perform your own research before making financial decisions.
Communications Professional. Crypto Enthusiast. Economic Journalist. Bitcoiner & Altcoiner.