

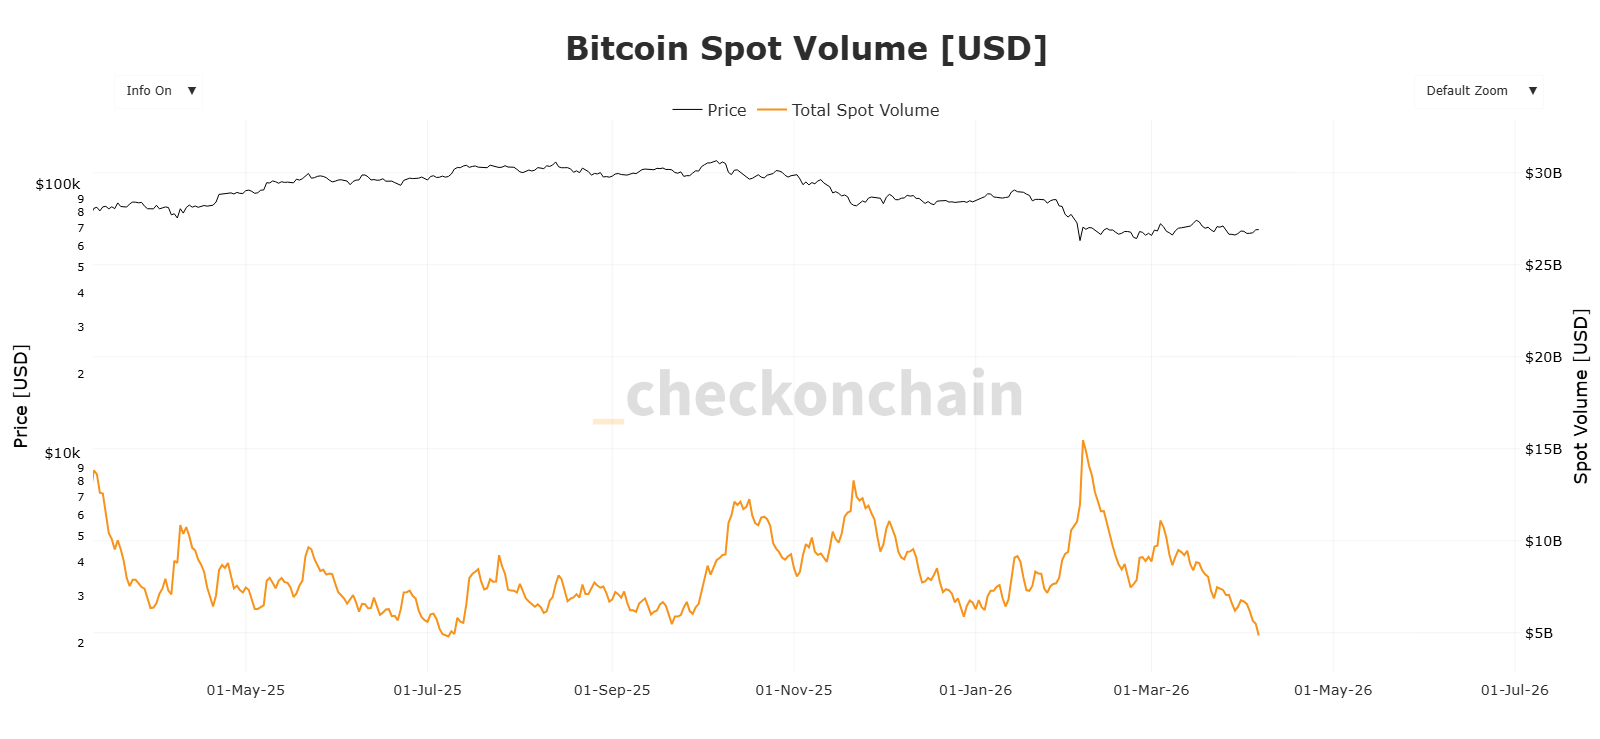
The commercial pulse of the Bitcoin network is slowing to levels not seen since late 2025. As of April 5, 2026, Bitcoin Spot Volume (USD) plummeted to $5.49B, with the asset trading at $69,034.00. This drop in direct exchange activity (spot) suggests that selling pressure is losing momentum after 180 days of a downtrend, opening the door for a potential silent accumulation phase.
A Historical Floor for Bitcoin Spot Volume (USD)
Data from Checkonchain reveals that we are facing the lowest activity level since September 21, 2025, when volume hit $5.47B. Currently, Bitcoin Spot Volume (USD) is testing a critical support level that has held firm since the low recorded on July 8, 2025 ($4.79B).
In on-chain analysis, low spot volume during a downtrend is typically interpreted as seller exhaustion. When spot trading volume (where actual assets are bought and sold, rather than derivatives) decreases drastically, it indicates that market participants are unwilling to offload their positions at current prices. It is, essentially, a “drying up” of the supply available for immediate sale.
Interpreting Accumulation Signals
The network’s recent trajectory provides clues regarding “strong hand” behavior:
The February Bounce: On February 6, 2026, Bitcoin Spot Volume (USD) peaked at $15.46B. This move coincided with bitcoin prices at $60,000.00, marking a zone of massive entry and institutional spot buying.
Fakeouts: On March 4, 2026, we saw an attempted volume rally reaching $11.10B, pushing the price to $74,050.00. However, the lack of follow-through returned the asset to a sideways trading range.
Since the descent began from the all-time high of $124,658.00 on October 6, 2025, volume has shown descending peaks. The first was on October 17, 2025 ($12.26B), followed by another on November 21, 2025 ($13.28B). Since then, recent peaks have trended lower. The fact that recent spikes fail to outperform previous ones while total volume collapses is a technical signal that bears are running out of ammunition.
Outlook: What to Expect Next?
When a downtrend loses trading volume, the narrative shifts from “panic” to “apathy.” Historically, apathy serves as the prelude to an accumulation phase where long-term investors absorb the remaining supply. If Bitcoin Spot Volume (USD) continues to test this floor without breaking lower, we could be witnessing the formation of a solid base for the next bitcoin bullish reversal.
Disclaimer: This analysis is for informational purposes only and does not constitute financial advice. Investing in crypto assets carries high risk.
Communications Professional. Crypto Enthusiast. Economic Journalist. Bitcoiner & Altcoiner.