

After weeks of uncertainty in the digital ecosystem, USDT dominance (USDT.D) issued a technical capitulation signal. Price, trapped in a complex corrective structure, failed in its attempt to reclaim critical levels, triggering a Short Setup scenario that historically precedes major bullish moves in risk assets.
The End of the Technical Bounce: A Glass Ceiling at 8.53%
The crypto market operates under a “communicating vessels” law: when stablecoin dominance drops, capital flows into assets. During recent sessions, we observed a recovery attempt in Tether dominance that ran head-on into massive supply.
The higher timeframe presents a macro-grade Bull Flag, a 59-bar descending channel attempting to digest previous gains. However, in the short term, this digital dollar “safe haven” is rapidly losing steam. The 8.53% level consolidated as an insurmountable resistance where dollar bulls exhausted their liquidity.
Technical Analysis: Breaking Down the Price Action
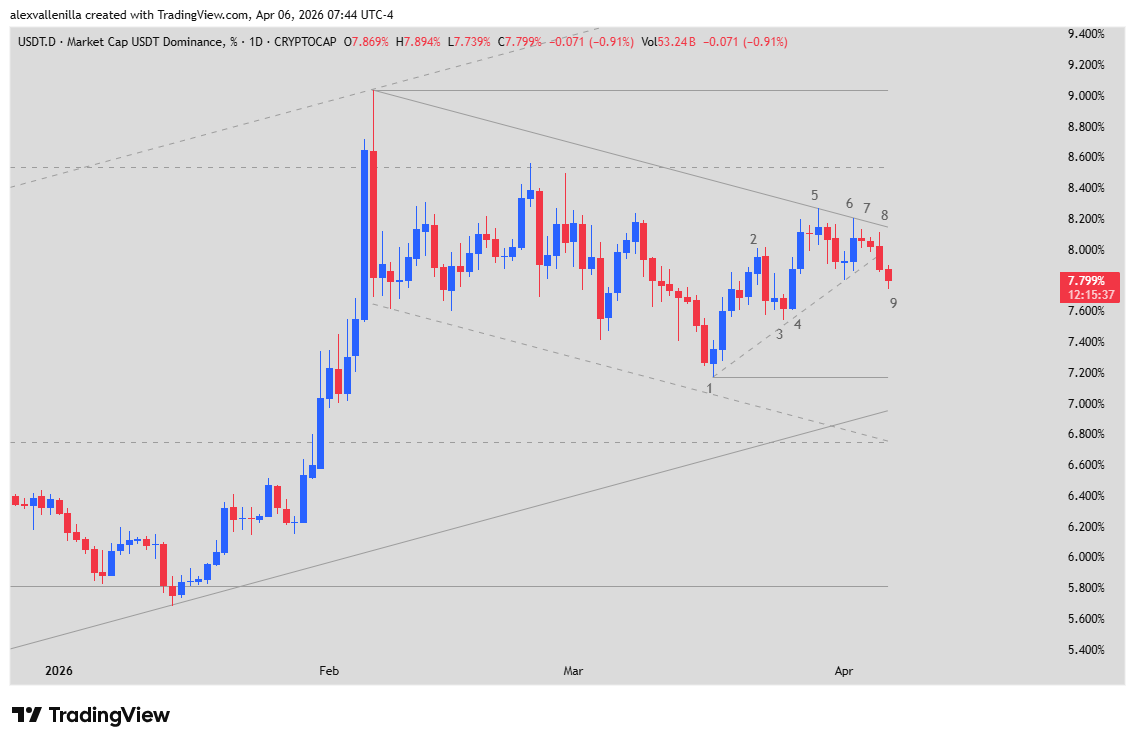
To understand where the market is heading, we must deconstruct the narrative of the recent bars, where trader psychology was captured in high-precision technical candlesticks.
The Trap and Exhaustion (Bars 1 to 5)
The move began with Bar 1, a selling climax that generated an automatic rally. However, this bounce quickly showed structural weakness. Although Bar 2 marked a Lower High, price sought support at Bar 3. The bulls’ final attempt occurred at Bar 5, a Shooting Star candle that completed a two-legged Measured Move. The fact that this bar failed to even test the 8.53% level confirmed a bull trap.
Confirmation of the Low 2 Setup (Bars 6 to 9)
The resolution of the conflict arrived with surgical precision:
Bars 6 and 7: Bar 6 acted as a Failed High 1, demonstrating a lack of buying interest above previous highs. Bar 7, an Inside Bar, reflected the momentary equilibrium before the storm.
Bar 8 (The Inflection Point): This candle is the key to the narrative. Technically identified as a Low 2 Setup, it closed below the micro-bullish trendline started at Bar 1. This is the “nail in the coffin” for USDT dominance.
Bar 9 (Activation): By breaking the low of Bar 8 (approximately at 7.89%), the mass sell order for dominance was triggered, which translates into aggressive buy orders for BTC/USDT pairs.
Projections: Where is the Capital Flowing?
The loss of momentum is evident. The upper wicks on bars 5, 6, and 8 suggest that every upward attempt is being absorbed by investors rotating their funds into bitcoin and altcoins.
Base Case: An imminent retest of the Bar 1 low at 7.16%. If current pressure holds, this level could be reached in the coming sessions.
Continuation Scenario: If the crypto rally gains traction, USDT dominance will target the main channel floor in the 6.90% – 6.94% zone.
The technical capitulation of USDT dominance at current levels is one of the strongest signals for the spot market. With the Low 2 activation, the stage is set for a potential “Altseason” or, at the very least, a robust bullish continuation in bitcoin’s price.
Disclaimer: This analysis is purely for informational and educational purposes. It does not constitute financial advice or investment recommendations. Trading digital assets involves significant risk.
Communications Professional. Crypto Enthusiast. Economic Journalist. Bitcoiner & Altcoiner.