

The Hyperliquid (HYPE) ecosystem is at a critical inflection point. After hitting a high of $43.33, the asset entered a technical correction phase that has kept it trapped in a 21-day bearish microchannel. Despite immediate selling pressure, the fundamental backdrop remains robust: the platform surpassed $2.3B in Open Interest (OI) within the Real World Assets (RWA) sector and recently finalized a strategic alliance with SushiSwap to power its perpetual markets. Is this pullback a “value buy” opportunity or the start of a test of long-term dynamic support?
Fundamentals and Alliances: The Engine Behind the Rally
HYPE’s performance is no accident. With a 260% appreciation over the last year, the protocol demonstrates resilience well above the DeFi market average. The integration with Sushi Perps not only expands its user base but also incentivizes liquidity through points multipliers, consolidating Hyperliquid as the go-to underlying infrastructure for decentralized trading.
However, in the short term, the market appears to be “digesting” massive gains, moving within a 76-bar structural ascending channel that still defines the primary trend.
Technical Analysis: Price Action Narrative
Price action over the last few days reveals a battle between retail capitulation and institutional absorption. Below, we break down the bar-by-bar structure:
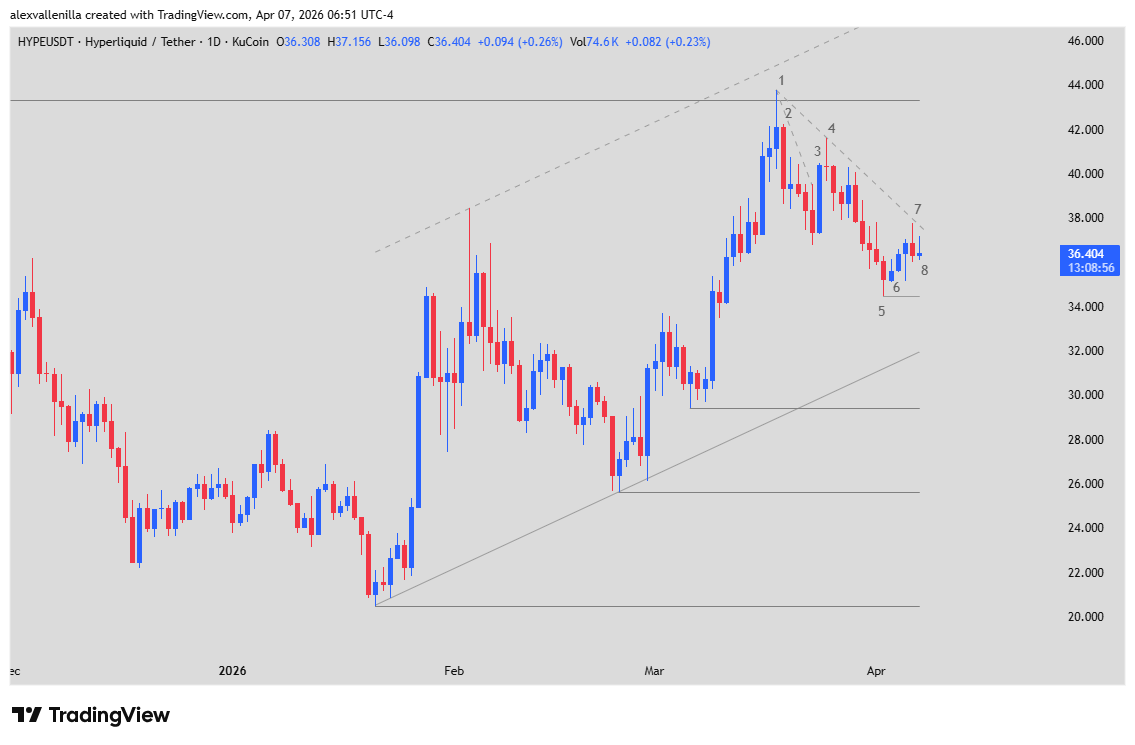
The Climax and Reversal (Bars 1-4)
Bar 1 marked a milestone by testing the $43.33 resistance, coinciding with the upper bound of the primary ascending channel. This “overshoot” generated a buying climax which naturally triggered a correction. Bar 2 confirmed this sentiment with a high-conviction reversal candle, acting as an aggressive throwback. Although bulls attempted to regain ground in Bar 3, the lack of follow-through allowed Bar 4 to establish a “lower high,” formalizing the current bearish microchannel.
Exhaustion Phase and Support (Bars 5-8)
Bar 5: Functioned as a “sell vacuum,” sucking price down to $34.45. Although the move was sharp, this level became the line in the sand for the bulls.
Bar 6: An inside bar that signaled a loss of momentum from sellers. The fact that its low respected the previous bar’s level suggests exhaustion.
Bars 7 and 8: Bar 7 unsuccessfully tried to resume the bearish path, while Bar 8 (current) trades sideways at $36.57. This compression indicates the market is waiting for a volume catalyst.
Strategic Scenarios: Entry Levels
HYPE‘s current structure suggests a 55% probability for a bullish scenario, provided the $34.45 support remains intact.
Bullish Breakout Scenario: If price closes above the Bar 7 high (approx. $37.50), it would validate a “bear trap.” This would release pressure toward a retest of the previous high at $43.33.
Bearish Continuation Scenario: If the Bar 5 support is lost, price would seek the lower trendline of the major channel, located near $31.93. This level represents a technical confluence zone where institutional interest typically reactivates.
HYPE is in a necessary “cleanup” phase following parabolic growth. As long as the adoption of its RWA technology continues to hit all-time highs, any pullback toward dynamic support will be viewed by specialists as a healthy consolidation within a long-term uptrend.
Disclaimer: This analysis is for informational and educational purposes only. It does not constitute financial advice. Trading crypto assets involves a significant risk of capital loss.
Communications Professional. Crypto Enthusiast. Economic Journalist. Bitcoiner & Altcoiner.