

The crypto market is moving through an April 2026 marked by technical duality and fundamental chaos. Litecoin (LTC), after breaking a 138-bar bearish wedge, is currently trapped in a critical trading range between $51.47 and $59.00. While the Litecoin Foundation attempts to inject optimism by announcing Alexis Roussel (Nym) for its Amsterdam summit, the coin’s price reflects the tension of a Middle Eastern conflict that pushed WTI crude oil above $100, forcing investors to reassess their exposure to risk assets.
Between Amsterdam and the Strait of Hormuz
The Litecoin narrative this year is one of resilience under fire. Despite a year-to-date decline of 30.47% in 2026, the asset shows signs of stabilization over the last month (-0.28%). The recent announcement regarding the participation of privacy experts at the Litecoin Summit (June 22-23) seeks to bolster the network’s intrinsic value, but the external “noise” is deafening.
The conflict between the U.S. and Iran not only spiked energy costs but also strengthened the dollar, creating a headwind for altcoins. However, price action analysis suggests LTC is attempting to build a solid base following seller exhaustion.
Technical Analysis: The Bar-by-Bar Battle
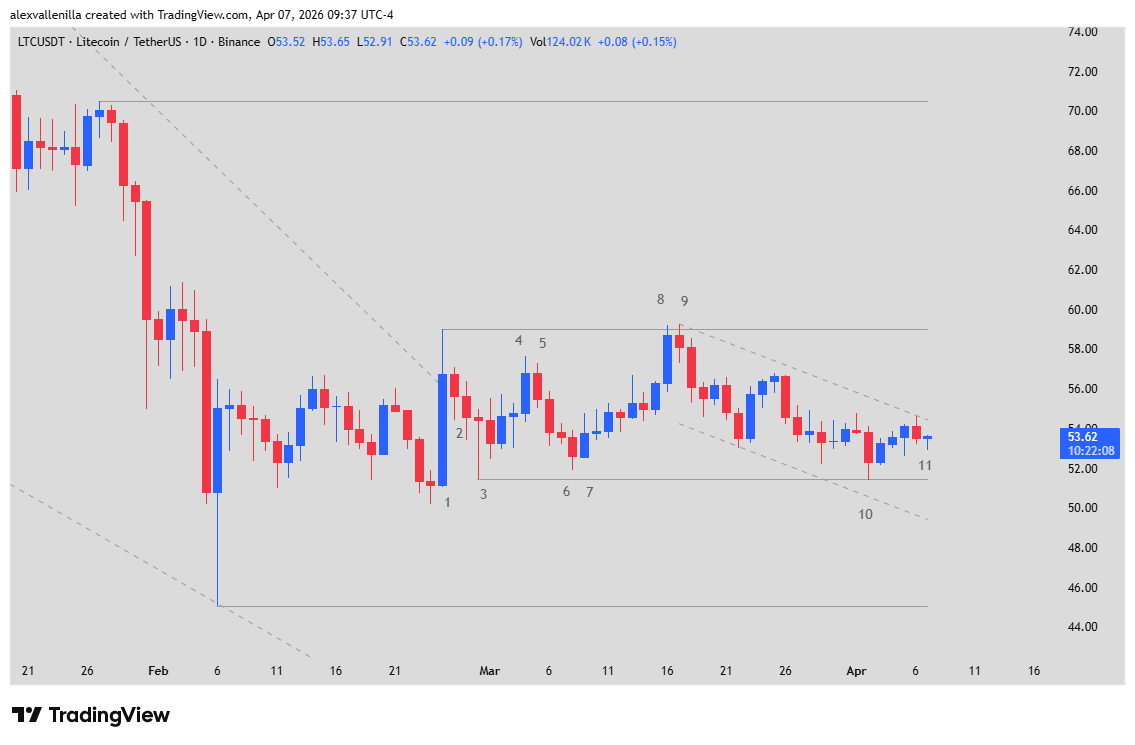
The LTC daily chart presents a classic transition from trend to range. Below, we break down the technical narrative based on the current bar numbering:
1. The Breakout and Resistance (Bars 1-2)
Bar 1 marked a milestone by breaking the 138-bar bearish trendline with a 10.97% move. However, this “Bull Surprise” hit a wall at $59.00, a level that has since acted as the ceiling for the current range. Bar 2 confirmed that a vertical breakout was not in the cards, initiating a consolidation phase.
2. Defining Critical Support (Bar 3)
Bar 3 is pivotal: a pin bar with a prominent lower tail. Bears attempted to regain total control, but demand at $51.47 was enough to establish this level as the trading range floor. The fact that it did not close below the low of Bar 1 shifted the bias from “active trend” to “sideways.”
3. The Bull Trap (Bars 8-9)
After a show of weakness in bars 6 and 7, Bar 8 executed a buy vacuum toward resistance. It was a 4.32% climatic move that ended in a Tweezer Top with Bar 9. This pattern trapped buyers who entered at the high (trapped bulls), triggering a two-legged correction.
4. Current Situation and Microchannel (Bars 10-11)
Bar 10 functioned as a successful test of the Bar 3 support, forming a local double bottom. Currently, Bar 11 shows typical indecision (Doji) at $53.62. A bearish microchannel starting at Bar 9 is “squeezing” the price. To see a recovery toward $59, we need a solid close above the high of Bar 11 to break this immediate pressure.
The Verdict
Litecoin remains in “wait and see” mode. Technically, we are looking at a Spike and Range pattern; the selling climax has passed, but bullish conviction is missing to target $70.49 (major resistance). The $51.40 – $52.50 zone is the line in the sand: if lost, a visit to $45.07 becomes inevitable. For now, the market is in the hands of scalpers and geopolitical headlines.
Disclaimer: This analysis is for informational purposes only and does not constitute financial advice. Crypto asset investments carry high risk.
Communications Professional. Crypto Enthusiast. Economic Journalist. Bitcoiner & Altcoiner.