

In a strategic shift marked by geopolitical de-escalation between the United States and Iran and record-breaking network activity, BNB successfully fractured a 176-day falling wedge. After rebounding with surgical precision off the $570 structural support, the digital asset is responding not only to macroeconomics but to an explosion of on-chain metrics that position BNB Chain as a leader among other Ethereum-compatible (EVM) networks. With the current price hovering around $612, the market is debating between the confirmation of a new bullish cycle or a necessary pause to absorb liquidity following a 3.33% intraday rally.
The Network Awakens: Data Backing the Price
Beyond the chart, fundamental analysis provides the necessary fuel for this movement. According to the latest report from intelligence firm Nansen, active addresses on BNB Chain scaled exponentially, consistently surpassing 2.5 million, compared to the one million recorded just a year ago.
Recent performance is even more aggressive: 11 million active addresses in recent days and a volume of 90.6 million transactions. These figures do not just validate token utility; they generate organic buying pressure through transaction fees, which reached $2.16 million this week, leading the EVM sector.
Geopolitics and Macro: Tailwinds for Risk Assets
The BNB rally does not occur in a vacuum. News of a two-week truce between the U.S. and Iran regarding the Strait of Hormuz triggered an immediate capital rotation. Falling oil prices injected optimism into risk assets. However, caution prevails; investors keep their eyes fixed on U.S. inflation data to be released this Friday, explaining the current consolidation in the $610 zone.
Technical Analysis: Breaking Down the Falling Wedge Breakout
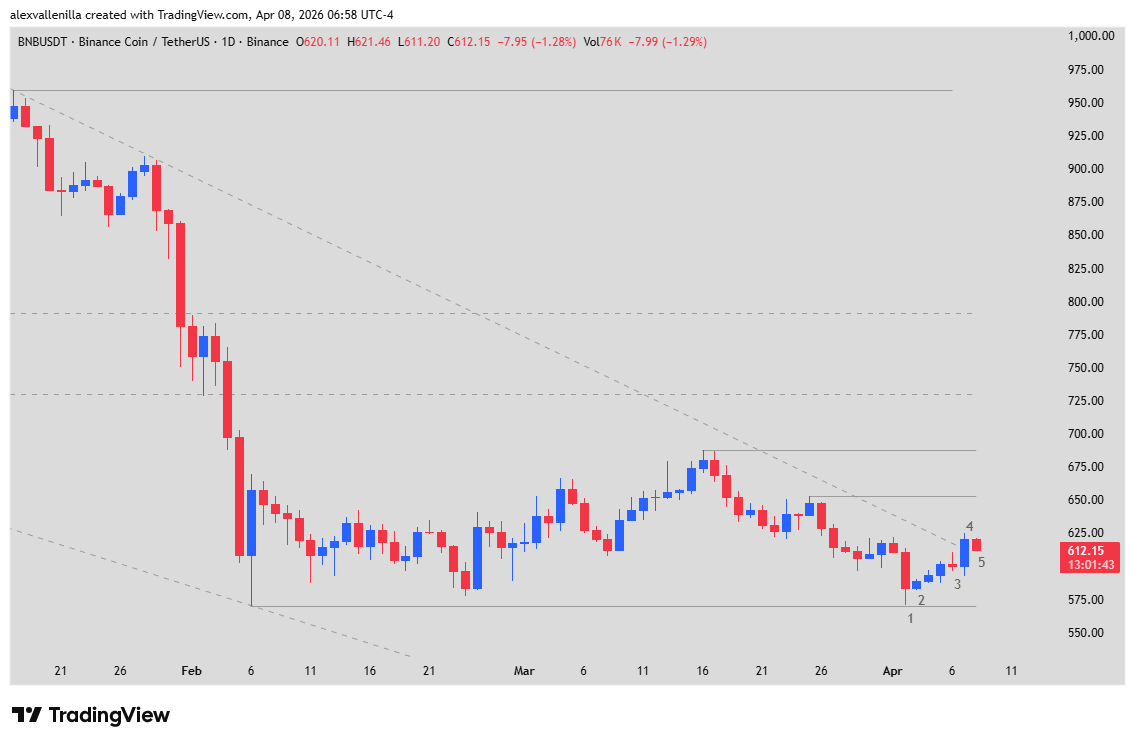
The daily chart presents a narrative of capitulation followed by bulls taking control. The primary structure, a 176-bar Falling Wedge, began to give way. Below is the detailed bar-by-bar price action analysis:
Bar Narrative
Bar 1 (Capitulation): Represents a climatic selling move. After three bearish “pushes,” price tested historical support at $570.06 (a 61-bar low). The prominent lower tail confirmed “Value Buying,” where institutions defended the level.
Bar 2 (Bearish Failure): A small-bodied Inside Bar. This was the first sign of seller exhaustion; unable to provide continuity to the Bar 1 low, the market printed a defensive pullback.
Bar 3 (Supply Test): A Doji with a long upper wick. Bears attempted to retake control near the trendline, but selling volume was insufficient to pierce the previous low. A signal of hesitation that paved the way for the explosion.
Bar 4 (The Breakout): The key piece. An Outside Up Bar that engulfed the previous range and closed decisively above the 176-bar trendline. This 3.33% advance marks a potential technical Change of Character (ChoCh).
Bar 5 (Current Consolidation): A bearish internal bar with a 1.30% retracement. Following the breakout effort, price seeks to establish a “floor” at $612. This is a natural pause before facing higher resistance levels.
Critical Levels and Projections
The structure of higher lows from Bar 1 to Bar 4 suggests solid accumulation. However, the path forward is not without obstacles:
Local Resistance ($653): The first major test. Surpassing this level would invalidate the last lower high of the previous bearish impulse.
Key Resistance ($688): The confirmation threshold. A close above this point would transform the structure from a “range” into a confirmed uptrend.
Safety Support ($570): As long as this level holds, the bias remains bullish. If it fails, the next refuge sits at $520.
A Technical Change of Guard
BNB took the first necessary step to shake off months of negative inertia. The combination of a vibrant network with 11 million users and a technical breakout of a half-year structure positions the asset in an early recovery phase. The key will lie in its ability to flip $610 into support before inflation data volatility hits the market on Friday.
Disclaimer: This analysis is for informational purposes only and does not constitute financial advice. Investments in crypto-assets carry high risk. Conduct your own research before trading.
Communications Professional. Crypto Enthusiast. Economic Journalist. Bitcoiner & Altcoiner.