

Internet Computer (ICP) is undergoing a critical phase of structural redefinition. Following a climatic capitulation, the asset is fighting to consolidate a floor while changes to the network’s governance (NNS) attempt to inject confidence into the fundamentals.
The digital asset market does not forgive indecision, and Internet Computer (ICP) currently finds itself in a “trench warfare” zone. After the crash that saw the asset test psychological levels near $2.00, price action has mutated from an aggressive bear channel into a complex trading range.
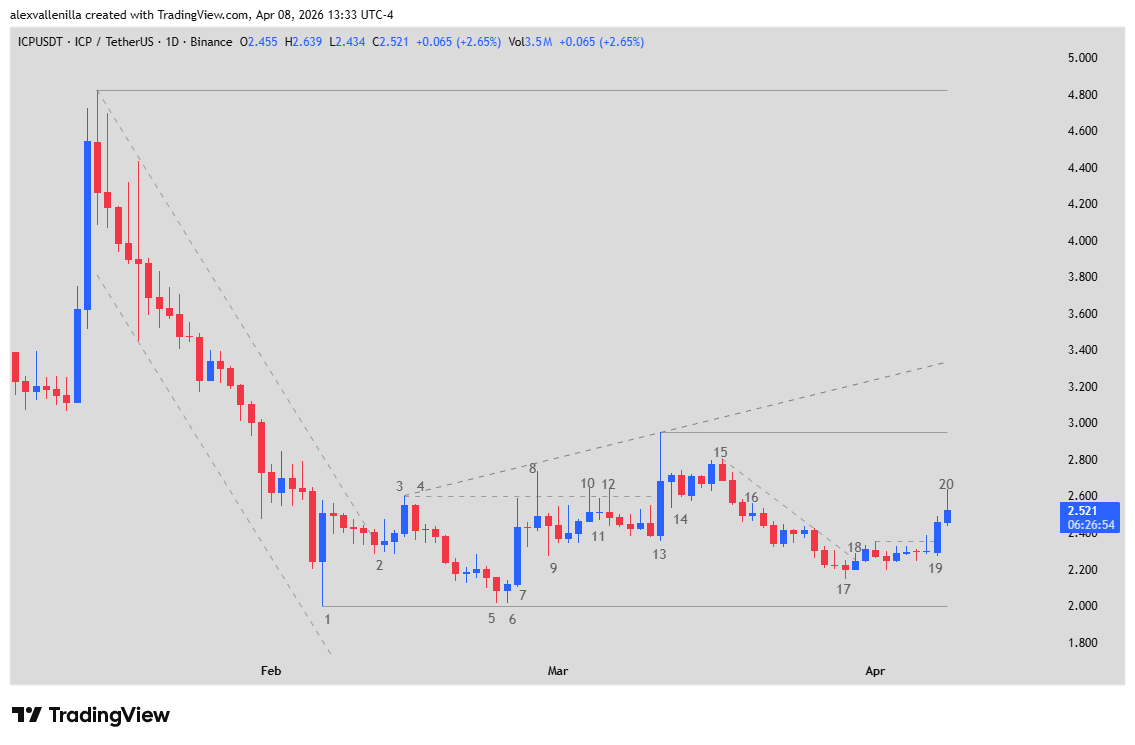
This movement coincides with relevant operational milestones: the approval of the NNS proposal to adjust voting and node rewards (Mission70)—a measure seeking to optimize the protocol’s tokenomics while the price technically attempts to shake off a downtrend that has dragged on for over 700 sessions.
Technical Analysis: The 20-Bar Narrative
Recent ICP/USDT behavior on the daily timeframe (1D) reveals a textbook transition according to Price Action methodology. Below, we break down the battle between supply and demand:
The End of Panic and the Birth of the Range (Bars 1-7)
Bar 1 marked the capitulation milestone; a Sell Climax that established critical support at $2.00. The trendline breakout in Bars 2 and 3 served as the first warning that the “sell-only” cycle had ended, giving way to a Spike and Range structure. The 14.88% jump in Bar 7 (Bull Surprise) confirmed that buyers possess firepower, although the failure to clear previous highs maintained skepticism.
False Breakouts and the $2.95 Resistance (Bars 13-16)
Bar 13 is perhaps the most educational bar on the chart. Although it managed to break previous resistance levels by reaching $2.949, the prominent upper tail defines it as a Buying Climax. Due to the lack of follow-through in Bar 14, the market punished the optimists. Bar 16 (a Low 2 Setup) acted as the trigger for a technical correction toward intermediate support levels.
Current Structure: The “Barbwire” (Bars 17-20)
Bar 17: A fundamental Higher Low. By failing to test the support of Bar 1, it indicates that selling pressure is losing conviction.
Bar 19: Acted as an Enuf Bar, breaking the lateral congestion or “barbwire” where the price had been trapped.
Bar 20 (Current): Trading at $2.544 (+2.77%), this candle confirms the breakout of the previous congestion. However, the presence of an upper tail warns that bears are still defending the overhead zone.
Projections and Scenarios
The market is currently in “Buy Low, Sell High” mode. There is no clear uptrend until we see consecutive closes above $2.95.
Bullish Scenario (55%): If ICP manages to close with a solid body above $3.00, the technical target shifts toward $4.82 (the start of the previous bear channel). This movement would likely be a “staircase” recovery—slow and with frequent pullbacks.
Range Scenario (45%): The persistence of upper tails in the current zone could pull the price back toward the $2.30 magnet, prolonging the accumulation phase.
ICP is in a supply absorption phase. While the network adjusts its economic incentives, the chart suggests that the $2.00 floor is solid, but the path to full recovery requires overcoming the fatigue of a long-term downtrend.
Disclaimer: This analysis is for informational and educational purposes only. It does not constitute financial advice. Investments in crypto assets involve a high risk of capital loss.
Communications Professional. Crypto Enthusiast. Economic Journalist. Bitcoiner & Altcoiner.