

In an unexpected turn combining geopolitical relief and textbook technical execution, Zcash (ZEC) has taken the lead in the crypto market. Following the announcement of a two-week truce between the United States and Iran and the reopening of the Strait of Hormuz, risk appetite returned with a vengeance. ZEC is not only leading gains within the CoinMarketCap Top 100 but is currently facing critical resistance at $333—a level that separates the accumulation phase from a confirmed bull market.
Geopolitics and the Market: The Breather Risk Assets Needed
The de-escalation in the Middle East triggered an immediate correction in oil prices, easing global inflationary pressures. This scenario acted as a catalyst for cryptocurrencies, with ZEC standing out due to a 67% monthly surge. Despite a challenging fiscal year with year-to-date (YTD) losses of -35.50%, the 878.30% year-over-year (YoY) return underscores the volatility and recovery potential of this privacy-focused asset.
Technical Analysis: The Anatomy of the Zcash Breakout
ZEC’s current structure is a case study in market cycle transitions. After breaking a primary 121-bar downtrend, price action shifted from a moderate channel into a vertical expansion move known as a Bull Spike.
Price Action Reading (Bar-by-Bar)
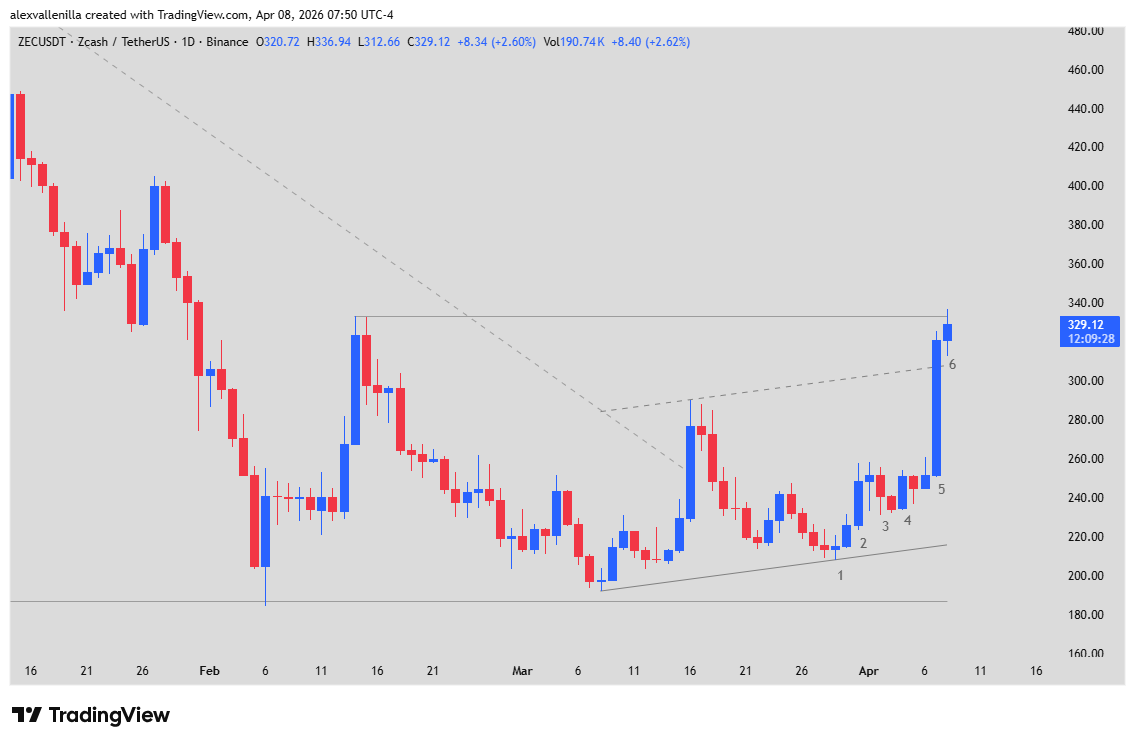
The technical narrative unfolds through key events identified on the daily chart:
Bar 1 (Bullish Doji): Following the downtrend line breakout, bears attempted to regain control. However, they failed to test the critical support at $187. This bar printed a Higher Low, signaling seller exhaustion.
Bar 2 (High 2 Setup): A high-probability configuration that triggered a buy signal by breaking above the previous lower high. This bar confirmed that the new bullish structure had institutional backing.
Bars 3 and 4 (The Bear Trap): In Bar 3, bears attempted a reversal that was immediately negated by Bar 4. The latter acted as a conviction Outside Bar, trapping short sellers and forcing them to cover their positions, which injected upward liquidity.
Bar 5 (The Bull Spike): An expanded range candle with 27.53% growth. Its close near the highs and above the upper line of the ascending channel indicates a “Measuring Gap,” suggesting that buyers are operating with urgency.
Bar 6 (Testing Key Resistance): Currently trading at $329.60, this bar represents the moment of truth. By reaching $333, ZEC is testing the final lower high of the former downtrend.
Projections: Where is ZEC Headed?
Surpassing the $333 barrier is vital. If price consolidates above this level, the market structure will complete its Change of Character (CHoCH), opening the door to a new macro cycle.
The next technical target, calculated via a Measured Move based on the width of the previous channel, sits at $405. However, following a vertical move like the one seen in Bar 5, short-term sideways price action or a Tight Bull Flag to absorb gains before the next leg up cannot be ruled out.
Zcash has moved from survival to the offensive. The combination of a bearish failure at key supports and an explosive response to favorable macroeconomic news has left sellers trapped. A daily candle close above $333 will serve as the stamp of approval long-term investors are waiting for to confirm the bull market.
Disclaimer: This analysis is for informational and educational purposes only and does not constitute financial advice. Investing in crypto assets carries a high risk of capital loss.
Communications Professional. Crypto Enthusiast. Economic Journalist. Bitcoiner & Altcoiner.