

The decentralized finance market is cautiously watching Arbitrum (ARB), which appears to have found a technical breather after a painful downtrend lasting nearly two hundred sessions. Within a “spike and range” dynamic, the asset is attempting to shake off the selling pressure that led to year-to-date (YTD) losses of -41.63%. With the deployment of protocols like Praxis and the expansion of El Dorado in Latin America, fundamentals are beginning to align with a price structure currently caught between capitulation and re-accumulation.
Network Awakening: Beyond Trading
While price struggles on the charts, Arbitrum’s infrastructure continues to evolve. The recent integration of Praxis Protocol reinforces the thesis that if AI agent activity translates into real on-chain volume, Arbitrum remains the preferred destination.
Furthermore, adoption in emerging markets like LATAM through El Dorado—which already exceeds one million users—positions ARB not just as a speculative asset, but as the liquidity layer for digital dollar (USDT) savings. However, financial rigor forces us to look at the candles: is this organic growth enough to reverse a dominant technical trend?
Technical Analysis: Anatomy of the Range (ARB 1D)
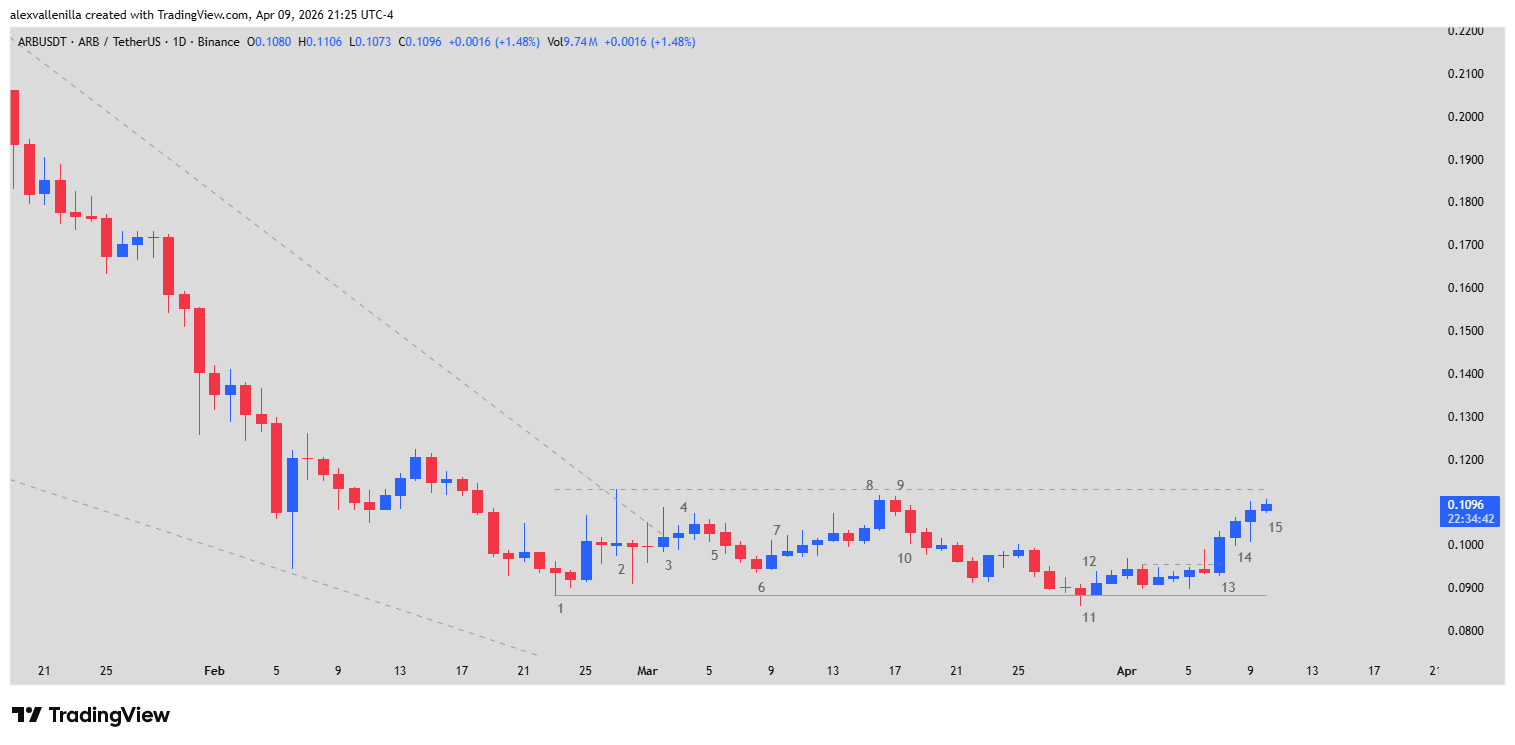
To understand ARB’s future, we must break down current price action using bar reading methodology. Currently, price is confined within a Trading Range following extreme exhaustion.
Phase 1: The Bottom and Initial Failures (Bars 1 to 5)
Bar 1: Following a 190-bar downtrend and a major 820-bar channel, a bearish pinbar appears, establishing critical support at $0.0883. This marks the all-time low and the end of a falling wedge.
Bar 2: The first bullish attempt. It pierces the trendline but closes as an upper pinbar, marking resistance at $0.1130. Bears were still defending their territory.
Bars 3 and 4: These show weakness. The attempt to retest the high of Bar 2 fails, confirming that buying pressure remained insufficient.
Bar 5: Technical reversal. Price loses traction and seeks liquidity at lower levels.
Phase 2: Consolidation and the Double Bottom (Bars 6 to 12)
Bar 6: Crucial. Bears fail to touch the support of Bar 1. This Higher Low is the first signal of seller exhaustion.
Bar 8: A bullish climax bar that, nonetheless, fails to test the Bar 2 resistance. This officially confirms the Trading Range.
Bar 11: The moment of peak tension. Price pierces the minimum support level, but bulls manage to close the price back inside. In professional technical analysis, this is known as a Failed Breakout of support—a trap that often catapults price to the opposite side of the range.
Phase 3: The Ongoing Breakout (Bars 13 to 15)
Bar 13: A strong bullish conviction Trend Bar that breaks the previous congestion.
Bar 14: Continuity. Buyers maintain control.
Bar 15 (Current): At the time of this report, ARB trades at $0.1101 (+2.22% intraday). The market is attacking the $0.1130 resistance. Unlike the attempts in Bars 2 and 8, current pressure shows more solid bodies, suggesting an accumulation of overhead pressure.
Where is ARB Headed?
The structure is clear: if bulls achieve a solid daily close above $0.1130, the immediate technical target shifts toward the $0.2277 resistance. This would mark the first real structural shift from bearish to bullish, though still within the shadow of the larger 820-bar channel. Conversely, a rejection at this level would return ARB to the bottom of the range, prolonging the agony for holders who saw their investment drop 62.82% over the last year.
Disclaimer: This information is for educational purposes only and does not constitute financial advice. Cryptocurrencies are high-volatility assets. Only invest capital you are willing to lose.
Communications Professional. Crypto Enthusiast. Economic Journalist. Bitcoiner & Altcoiner.