

The crypto market reacted strongly this Friday following the release of U.S. inflation data. As the Dollar Index (DXY) retreated to intraday lows of 98.637, bitcoin (BTC) capitalized on the momentum to trade above $73,000. This move, fueled by core inflation (2.6%) coming in below market forecasts, allowed the leading cryptocurrency to challenge a structural descending channel that has remained in place for 186 days, opening the door for a new price discovery phase.
Macroeconomic Tailwind: The DXY Breathing Room
The current narrative is best understood through a macro lens. According to Stephen Coltman, an analyst at 21shares, the lack of a broad-based inflationary trend and the exhaustion of post-pandemic savings among U.S. consumers are limiting dollar strength.
While headline inflation rose to 3.3% due to the impact of crude oil prices stemming from the conflict in Iran, investors have focused on core inflation. This softer-than-expected reading suggests that pressure on the Federal Reserve could stabilize—a scenario that historically favors risk-on assets like bitcoin.
Technical Analysis: The 186-Bar Battle
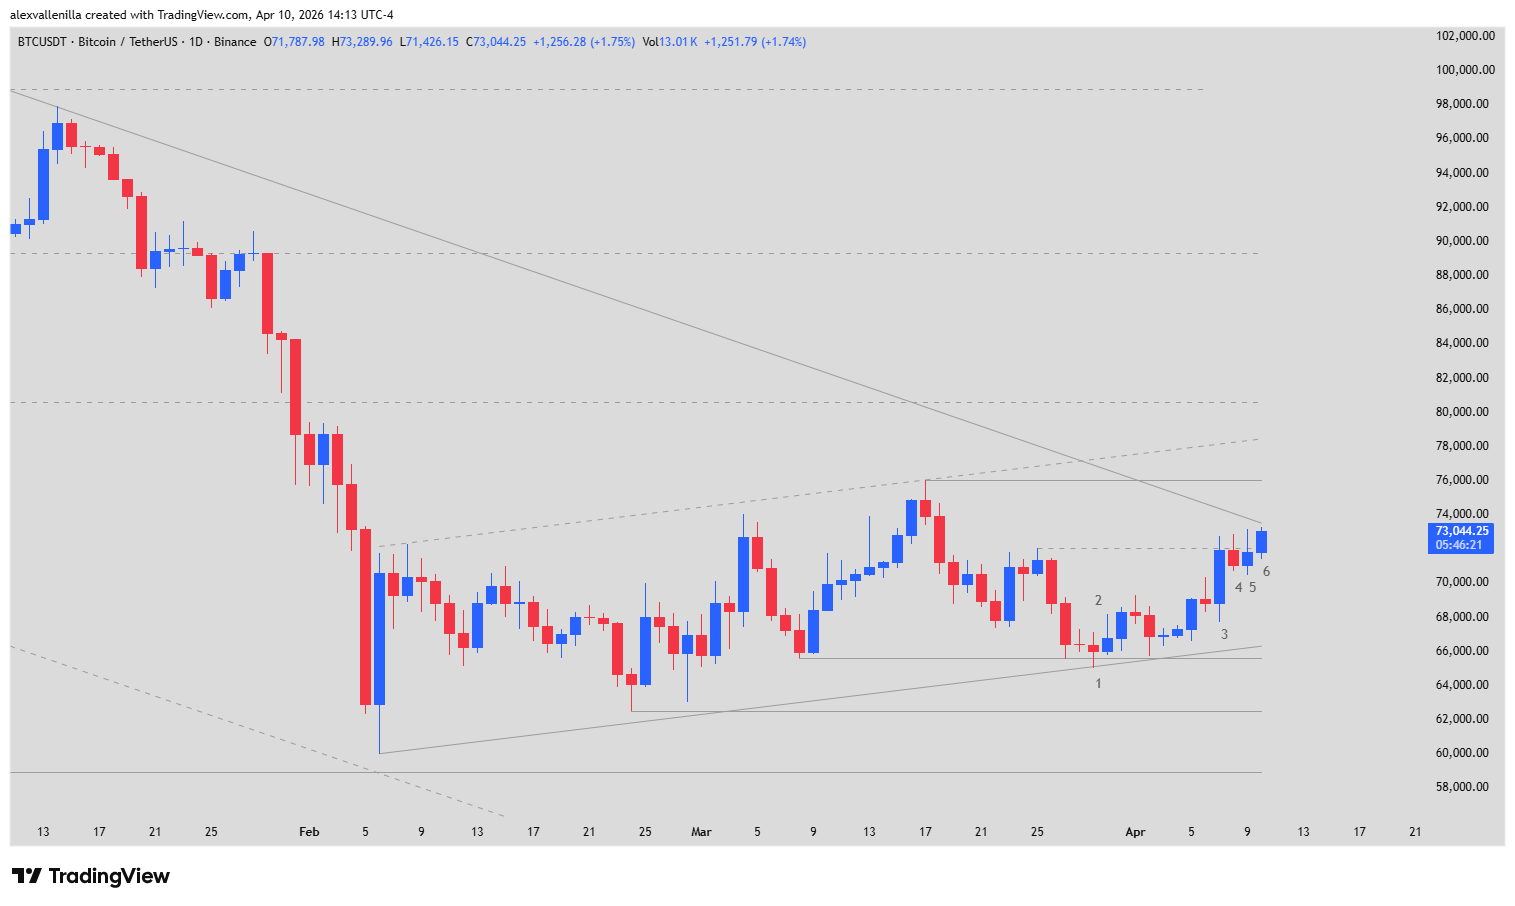
Bitcoin’s daily chart (1D) reveals a “channel within a channel” setup. After an extended corrective period, price began building a recovery structure that faces its litmus test today.
Price Action Narrative (Bar-by-Bar)
To understand our trajectory, we must break down the microstructure of the last few days:
Bar 1 (Support at $65,600): A critical doji. Bears attempted to pierce support, but the close above $65,600 proved that buy limit orders are defending this zone. This point marks the start of the 63-bar counter-trend ascending channel.
Bar 2 (Bear Trap): Sellers betting on a breakout in the previous bar were trapped. Lacking bearish follow-through, the market generated a two-legged upward move.
Bar 3 (Impulse Candle): With a 4.46% surge, this large-bodied candle definitively invalidated the immediate bearish scenario. This “bullish surprise” tested $72,000 with conviction.
Bar 4 and 5 (Reversal Failure): After a necessary pause (Bar 4), bears unsuccessfully tried to regain control. Bar 5 acted as an outside bar, overtaking the previous high and confirming that buying pressure remains intact.
Bar 6 (Current): Bitcoin is trading above $73,000 (+1.83%). At this moment, price is “hugging” the upper trendline of the primary 186-day descending channel. The lack of a violent rejection in this area suggests supply absorption, increasing the probability of a successful breakout.
Projection: The Path to $77,000
If bitcoin manages to consolidate a daily close above the bearish trendline and the $74,000 psychological resistance, it would trigger a measured move. This two-legged bullish cycle, which began at $62,500, has a technical target of $77,000.
An advance of this magnitude would not only clear the fixed resistance at $76,000 but would transform the market structure from bearish/sideways into a new long-term bullish impulse.
Bitcoin sits at a high-volatility confluence of technical and macroeconomic factors. Dollar weakness provided the necessary catalyst for price to challenge a six-month structure. The next 24 hours will be decisive in confirming whether we are witnessing a definitive trend reversal or a trap at the top of the channel.
Disclaimer: This analysis is for informational and educational purposes only. It does not constitute financial advice or investment recommendations. Cryptocurrencies are high-volatility assets; trade at your own risk.
Communications Professional. Crypto Enthusiast. Economic Journalist. Bitcoiner & Altcoiner.