

The crypto ecosystem is weathering a high-tension week as bitcoin ($BTC) struggles to define its technical direction against a complex geopolitical backdrop. While institutional capital inflows into Bitcoin ETFs inject liquidity and optimism, the breakdown of peace negotiations between Iran and the United States—coupled with a potential blockade of the Strait of Hormuz—has reignited selling pressure. With a weekly close at $70,740.98 and a moderate gain of 2.47%, the price remains trapped in a critical confluence between a six-month descending channel and a micro-uptrend searching for a breakout miracle.
Geopolitics vs. Liquidity: The “Digital Gold” Dilemma
Bitcoin has demonstrated astonishing resilience. Despite the drums of war and surging oil prices following Vice President JD Vance’s announcements regarding the lack of an agreement with Iran, the cryptocurrency did not collapse. The “safe-haven asset” narrative is being put to the test: while oil climbs due to logistical risks in Hormuz, bitcoin is absorbing supply thanks to positive net flows into ETFs.
This phenomenon suggests that while retail sentiment fears wartime volatility, institutional money views corrections as accumulation opportunities, establishing a psychological floor that bears have failed to pierce.
Technical Analysis: The Bar-by-Bar Battle
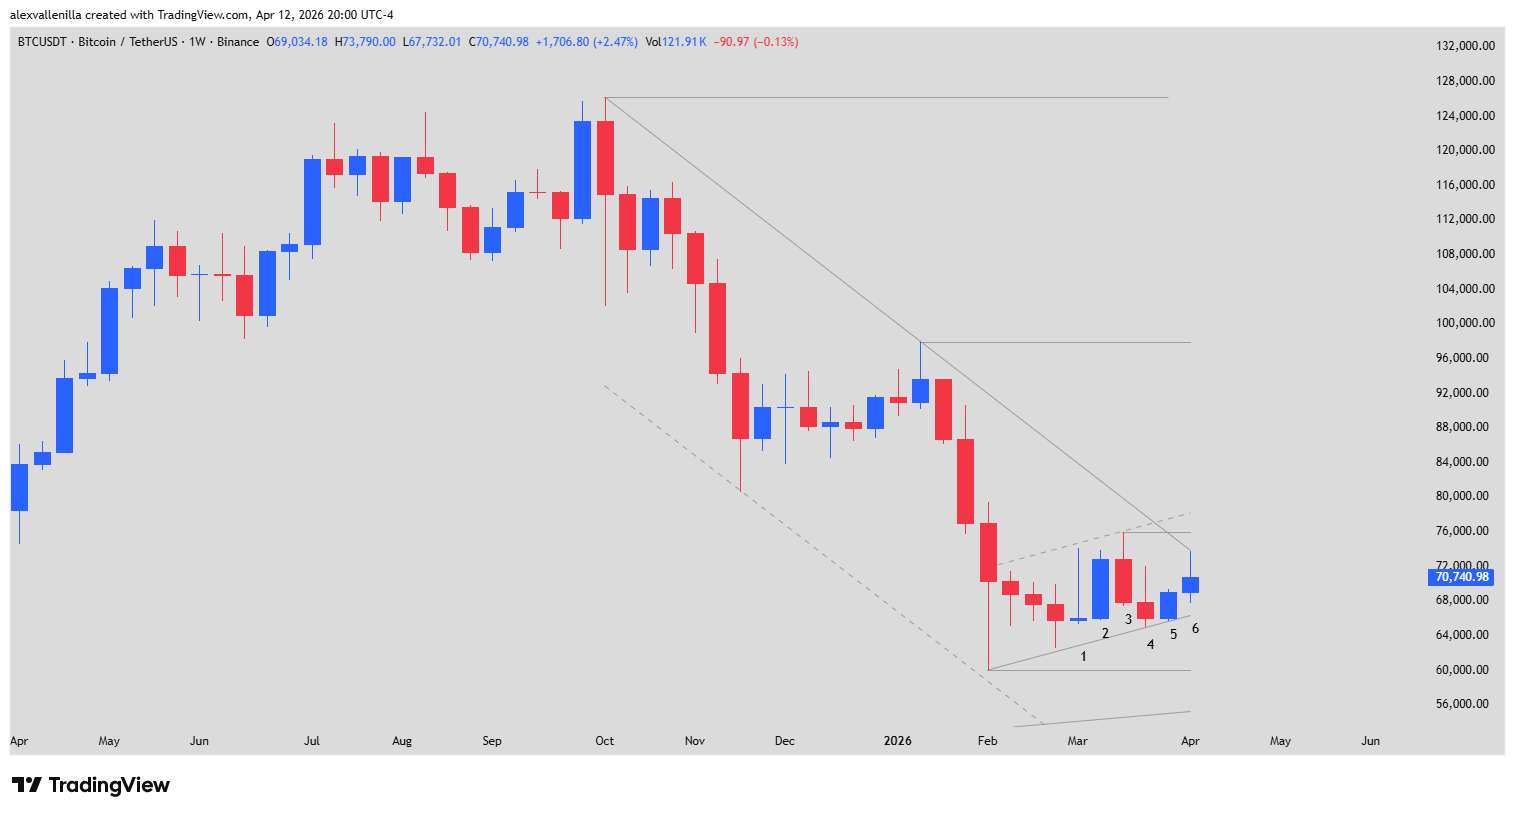
To understand the current movement, we must break down the price action on the weekly (1W) chart. We are facing a complex structure where a 9-bar micro-channel is attempting to challenge a dominant 26-bar downtrend.
Bar Narrative (1W)
Bar 1: Represented the first reversal attempt. The large upper wick confirms bears defended the area, but breaking above the highs of the previous three weeks revealed latent demand.
Bar 2: A bullish conviction Inside Bar. By failing to breach the high of Bar 1, the market entered a necessary phase of pause and consolidation.
Bar 3: Bulls marked a new local high following the initial climactic drop. However, it closed bearish with a wick covering 30% of the range, signaling exhaustion after tagging the $76,000 resistance.
Bar 4: Bears attempted to regain full control but failed. The result was a Higher Low, serving as an anchor point for the current micro-channel trendline.
Bar 5: Another consolidation Inside Bar. The bears’ inability to pierce the low of Bar 4 signaled that selling pressure is dissipating near the $60,000 support.
Bar 6 (Current): A classic Pin Bar closing at $70,740.98. Although rejected by the descending channel’s dynamic resistance (located at $73,800), the body closed positive (blue), indicating that buyers absorbed the weekend selling pressure.
Scenarios: Where is the price headed?
Structural analysis shows bitcoin moving within what technically appears to be a Bear Flag. Nevertheless, institutional accumulation at the base of the channel could invalidate this pattern.
Bullish Scenario: A breakout and solid close above $76,000 is required. This would break the 26-week channel and open the path toward a medium-term technical target of $88,000.
Bearish Scenario: If price loses the micro-channel support at $66,300, a re-test of $60,000 is highly probable. A close below this level would trigger targets at $55,200 and, in the event of extreme panic, $49,000.
Bitcoin is currently in a “compression” phase. The confluence of negative geopolitical forces and positive institutional absorption data suggests the market is waiting for a definitive catalyst. Next week will be crucial in determining whether Bar 6 was a simple rejection or the final breath for the bears before a historic breakout.
Disclaimer: This analysis is for informational and educational purposes only. It does not constitute financial advice or an investment recommendation. Cryptocurrencies are high-volatility assets.
Communications Professional. Crypto Enthusiast. Economic Journalist. Bitcoiner & Altcoiner.