

The Polkadot ecosystem is weathering one of its most critical periods to date. While DOT’s technical structure already exhibited deep structural weakness, a hack on the Hyperbridge gateway to the Ethereum network provided the necessary fuel for a bearish breakout. Although the Polkadot Foundation clarified that native assets remain secure, the market responded with massive sell-offs, driving the token to trade at 1.171 USDT—an intraday drop of 4.33% that threatens a retest of all-time lows.
Hyperbridge Vulnerability: A Billion Reasons for Fear
The news broke across social media and monitoring platforms like Certik. Attackers managed to exploit a vulnerability in the Hyperbridge gateway, artificially minting one billion DOT tokens on the Ethereum network. Although low liquidity in exchange pools limited the hackers’ realized gains to approximately $237,000, the reputational damage was immediate.
High-volume platforms such as Upbit and Bithumb suspended deposits and withdrawals, creating a confidence vacuum. Polkadot issued an official statement assuring that “the exploit only affects bridged DOT on Ethereum and not the native ecosystem,” but for day traders, the “sell the news” narrative overrode technical reality.
Technical Analysis: “Always In Short” Dominates the Scene
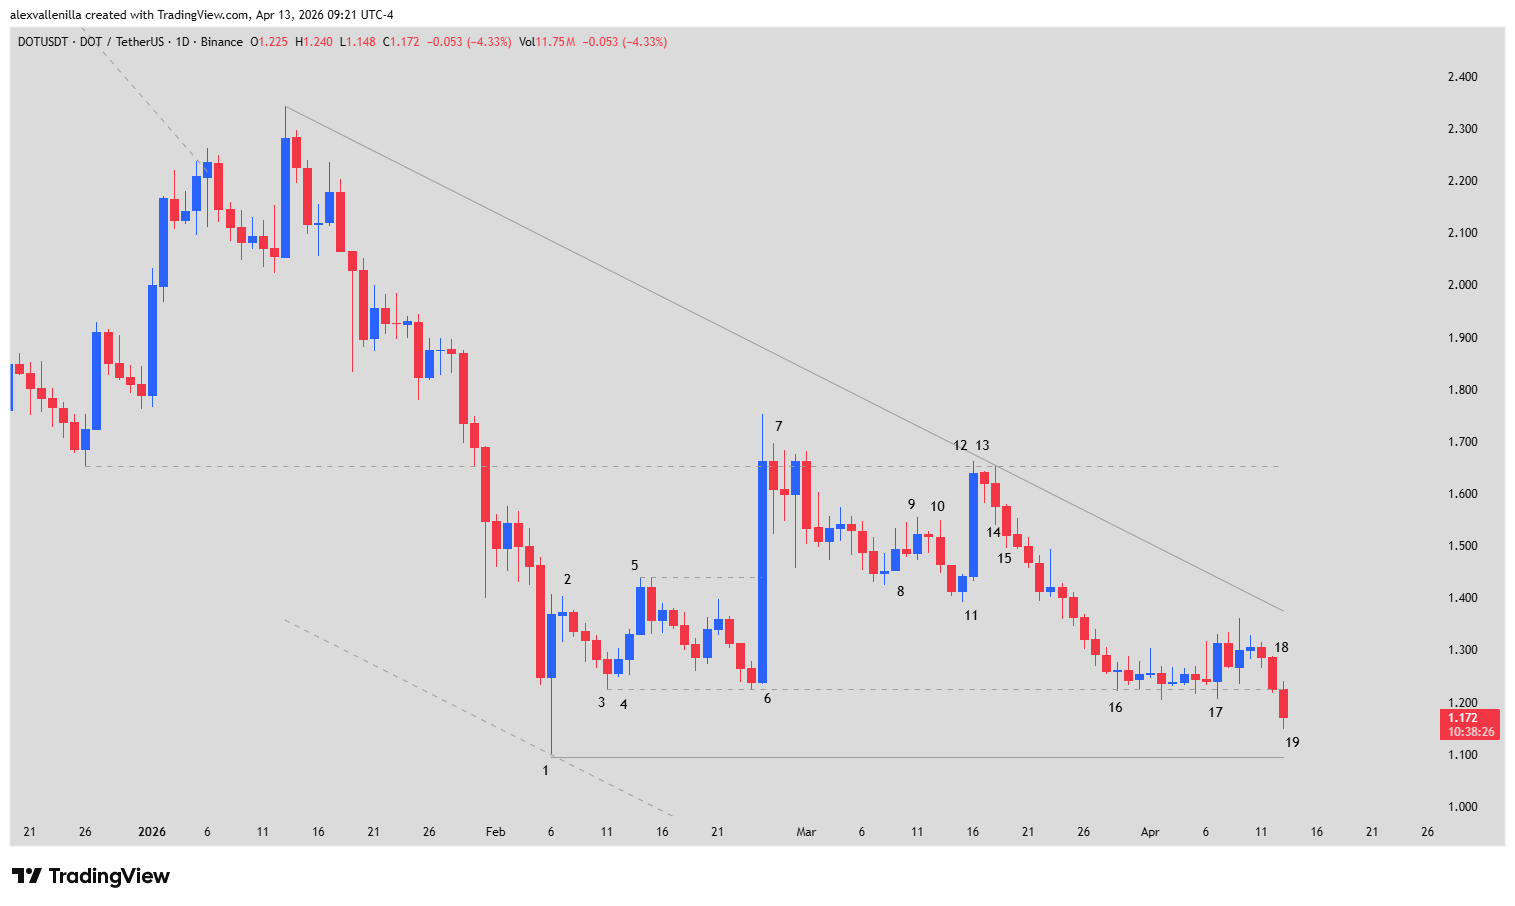
From a Price Action perspective, the DOT/USDT pair on the daily (1D) timeframe is a textbook example of a dominant bearish structure that evolved from a climatic drop into a Broad Bear Channel.
Price Action Breakdown (Bar-by-Bar):
Bars 1 to 3 (The Failed Base): Bar 1 acted as a climatic Reversal Bar that halted the slide at 1.092. However, Bar 3, despite establishing a Higher Low at 1.225, showed a lack of buying volume that signaled fragility.
Bar 6 (The Perfect Trap): This move was a violent 34.33% rally. While it appeared to show “strong conviction,” it was technically a Buy Vacuum that tested resistance at 1.653. By failing to touch the upper trendline, it was confirmed as a Bull Trap.
Bar 12 and Channel Failure: Bulls attempted another assault, but Bar 12 failed before even reaching the 90-bar trendline. This “shortfall” is a sign of extreme weakness.
Bar 15 (Low 2 Setup): Following the Bar 12 failure, Bar 15 confirmed a Low 2 Setup. This is the high-probability sell signal for professionals, marking the beginning of the end for the sideways range.
Bars 18 and 19 (The Current Breakout): Bar 18 failed in its recovery attempt, and Bar 19 (current) finally pierced critical support at 1.225. With price sitting at 1.171, the market has “opened the gates” to test the Bar 1 low (1.092).
Projection Analysis: Where is the Bottom?
Sentiment reflects gradual capitulation. With year-to-date losses exceeding 68%, DOT remains in Always In Short mode.
If the Bar 19 close consolidates below 1.175, the high-probability scenario is a visit to the $1.000 psychological level. Should the Bar 1 support (1.092) break, Polkadot would enter a downward price discovery phase, with the all-time low of 0.633 serving as the final technical bastion.
A Future Dependent on Support
Polkadot faces a “perfect storm”: a flawless bearish technical structure combined with security noise surrounding its bridges. The network’s success in the coming weeks won’t depend on its parachain innovations, but rather on the ability of buyers to defend the 1.092 level. Otherwise, the winter for DOT could turn arctic.
Disclaimer: This analysis is for informational and educational purposes only. It does not constitute financial advice or investment recommendations. Trading crypto assets carries a high risk of capital loss.
Communications Professional. Crypto Enthusiast. Economic Journalist. Bitcoiner & Altcoiner.