

The cryptocurrency market is showing signs of supply capitulation at key support levels once again. Chainlink (LINK) is currently navigating a decisive phase on its daily (1D) chart. After successfully defending the critical $7.15 zone—a structural support level that has held intact for the last 165 bars—price action suggests the formation of a solid accumulation floor following a prolonged 200-bar primary downtrend.
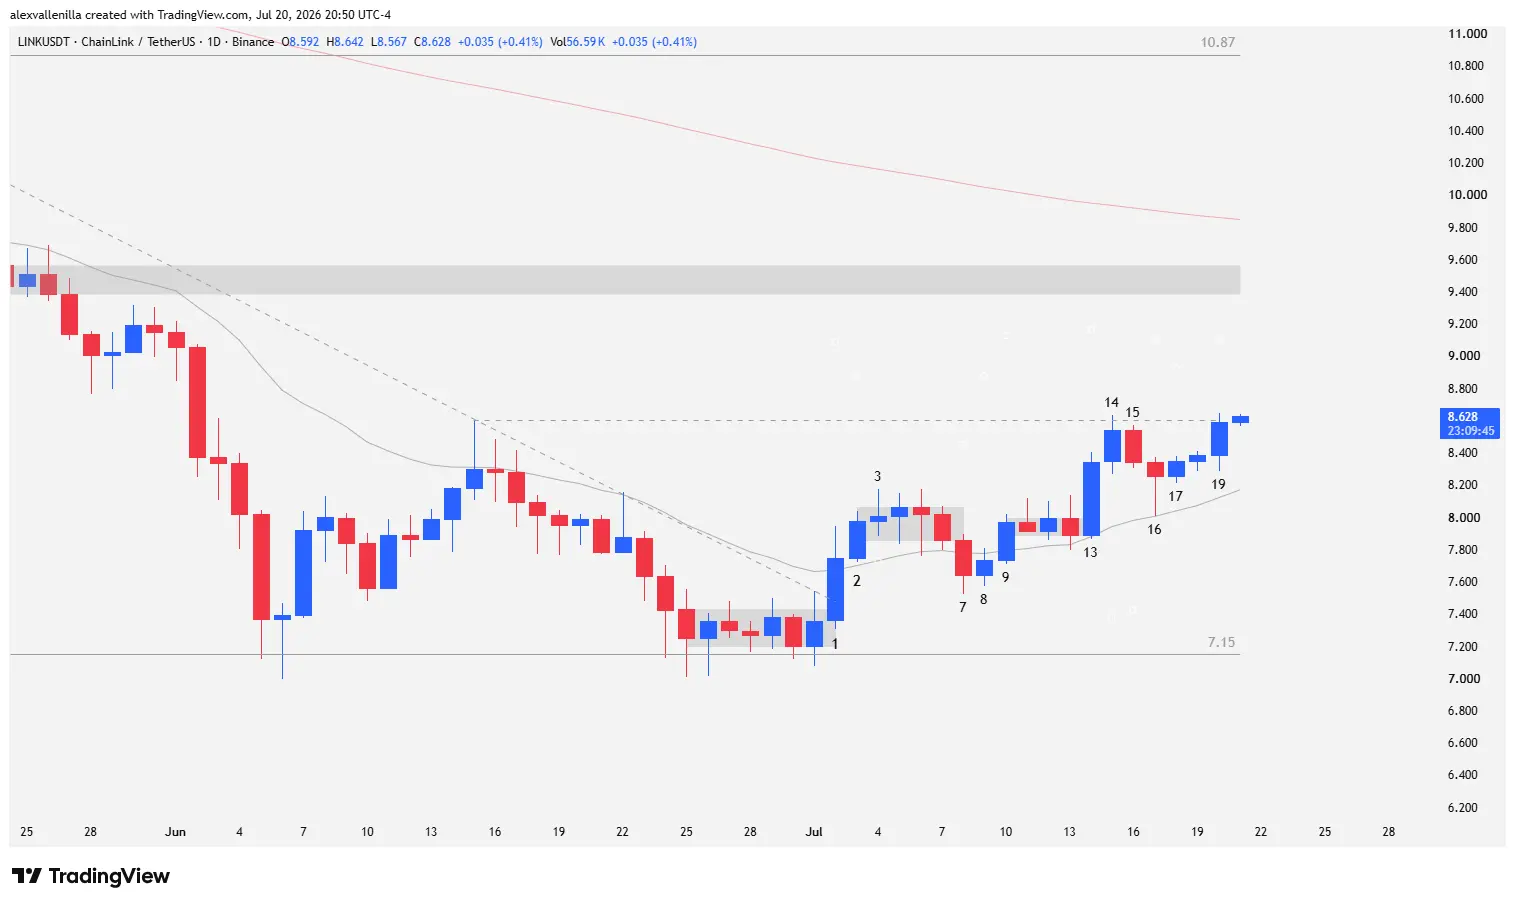
Buyers took the initiative by invalidating short-term selling pressure, breaking out of a 50-bar secondary minor downtrend channel. This move generated a two-legged bounce structure that is testing intermediate resistance at $8.60. A decisive breakout above this threshold would clear the path toward the main bearish stronghold at $10.87.
Technical Price Action Analysis: Bar-by-Bar Reading
A detailed study of crowd psychology and order flow reflects how smart money absorbs selling volume across different trading sequences:
Initial Launch and First Pullback (Bars 1 to 3)
Bar 1: Kicks off the move with a high-conviction bullish bar dominated by smart money. Bulls break through the 50-bar secondary downward trendline and confirm the double bottom at $7.15. As bears fail for a second time to break below this level, the market applies a fundamental rule of price action: when a target fails twice, price seeks the opposite direction. The bar closes comfortably above the 20-period Exponential Moving Average (20 EMA) and clears a previous tight trading range.
Bar 2: Serves as a bullish follow-through bar. Buyers reaffirm the breakout above the 20 EMA and the 50-period secondary trendline.
Bar 3: Momentum halts abruptly with the print of a doji. Price fails to close above the high of Bar 2, immediately entering a three-bar tight trading range without a clear direction.
The Bear Trap and Failed Breakout (Bars 7 to 11)
Bar 7: Bears attempt to regain control of the primary trend, breaking down through the tight range and the 20 EMA. However, they make a tactical error: the low of this bar fails to test the master support at $7.15.
Bar 8: A bullish inside bar appears, halting the fall of Bar 7. This invalidates bear follow-through, traps aggressive short sellers, and creates a failed breakout of the tight trading range.
Bar 9: Delivers follow-through on the Bar 8 failure, driving the price back above the 20 EMA.
Bars 10 and 11: Bar 10 attempts a pullback that quickly fails on Bar 11, returning the asset to a temporary compression phase.
Building the Second Bullish Leg (Bars 13 to 19)
Bar 13: A wide-range, high-conviction bullish bar emerges. Smart money re-enters at higher levels, confirming that the $7.15 zone functions as a solid floor. This move starts the second bullish leg to complete the cycle from Bar 1.
Bar 14: Momentum tests resistance at $8.60, a level that coincides with the last relevant swing high of the previous minor downward channel. Supply reacts, and price fails to close above it, marking a temporary failed breakout.
Bar 15: Prints a bearish inside bar that traps late buyers from Bar 14. Its high fails to extend the move, setting up a short-term pullback.
Bar 16: Sellers break below the low of Bar 15, but the move loses steam. The bar finishes as a pinbar with a prominent lower tail. Although it tests the 20 EMA, bears fail to close below it. Crucially, this bar establishes a higher low relative to Bars 13, 7, and 1, starting to outline a minor counter-trend upward channel.
Bar 17: A narrow-range bar that completely overlaps with Bar 16. The lack of bear follow-through validates the behavior of the previous pinbar.
Bar 19: Bulls resume the attack and slightly penetrate resistance at $8.60, demonstrating that demand is absorbing available supply at that ceiling.
Market Outlook: Key Levels and Scenarios
The macro context reveals that $10.87 represents the peak of the first bull trap following the previous attempt to break the primary downtrend. Although that trap pushed price back to the $7.15 support, sellers could not break the overall market structure.
Bullish Scenario: If demand manages to print full-body candles above $8.60, price will directly seek the previous magnetism and congestion zone on the way to $10.87. Reclaiming and consolidating above $10.87 will permanently invalidate the 200-bar downtrend, initiating a new medium- and long-term bullish cycle.
Bearish Scenario: If price suffers another rejection at $8.60, the first line of defense will be the dynamic 20 EMA, located at $8.16. Losing the 20 EMA would send the market back toward the double bottom base at $7.15.
Chainlink exhibits a clear accumulation pattern where every selling attempt forms higher lows above key support zones. The current interaction with $8.60 resistance will dictate whether the asset is ready to neutralize its long-term downtrend or if it needs more time to consolidate within its current structure.
Disclaimer: This article is strictly for informational and educational purposes. It does not constitute financial advice, investment recommendations, or an offer to buy or sell digital assets. Always conduct your own research before making investment decisions.

Communications Professional. Crypto Enthusiast. Economic Journalist. Bitcoiner & Altcoiner.


