

The Flare (FLR) cryptocurrency is showing clear signs of seller exhaustion on its daily (1D) chart. Following prolonged selling pressure within a 60-bar secondary trend, price action reveals active institutional capital entry in discount zones. The recent failed bearish breakout and the push above key moving averages suggest the token is attempting to build a solid floor to reverse the dominant trend.
Deceleration and Exhaustion in Selling Pressure
The FLR market experienced a marked slowdown in downside momentum. Recent sell-offs displayed narrow-range bars with constant overlap and tails on both ends—a classic symptom of supply disinterest at these low levels.
Despite bears’ attempts to deepen the drop within the 301-bar primary trend, a lack of follow-through confirmed that selling order flow ran out of steam, allowing price compression to form a falling wedge at the bottom of the range.
Technical Analysis: Bar-by-Bar Reading and Market Psychology
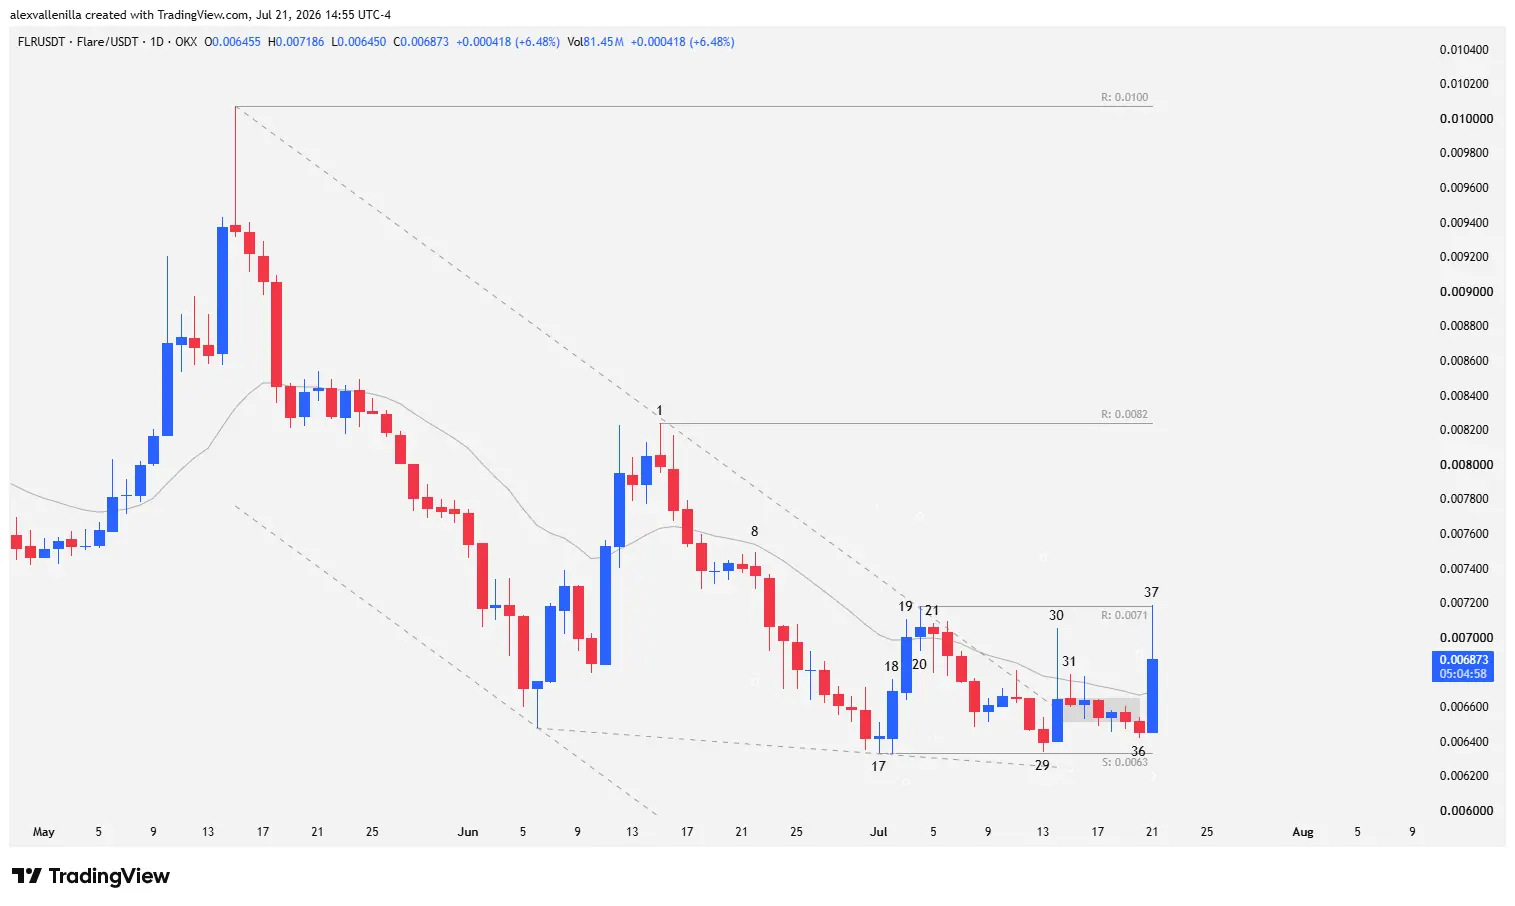
Bottom Formation and First Buy Signal (Bars 17 to 20)
Bar 17: A doji stops the two-legged drop inside the secondary bear channel, establishing critical support at $0.0063. The absence of follow-through after Bar 16 highlights sellers’ inability to extend the move.
Bar 18: Smart money enters the market with a wide-range candle that takes out the high of Bar 17, triggering an immediate bullish reversal.
Bar 19: A second bullish conviction bar confirms the defense of the $0.0063 support and closes above the 20 EMA, though without reaching the mini bear channel’s trendline.
Bar 20: Indecision appears via a doji. Buyers attempt to break the 60-bar trendline but face rejection, leaving a control high at $0.0071.
Double Bottom Formation and Wedge Compression (Bars 21 to 29)
Bars 21 and 22: Bears react by causing a two-legged pullback. Bar 22 (an outside bear bar) pushes price back below the 20 EMA, but the second leg down is noticeably shorter, confirming a loss of downside momentum.
Bar 29: A small candle attempts to retest the $0.0063 level and fails, confirming a double bottom relative to Bar 17. This move slows the drop and forms the apex of a falling wedge.
Volatility Spike and Trapped Bears (Bars 30 to 37)
Bar 30: Buying capital reappears with extreme volatility. Bar 30 breaks the 60-bar trendline and tests the $0.0071 resistance. Although selling rejection creates a long upper tail that closes below the 20 EMA, the breakout of the primary trendline remains valid.
Bars 31 to 36: Price enters a micro-range of congestion below the 20 EMA. On Bar 36, bears try to break the consolidation downward, but the candle lacks range and volume, holding its low above key support at $0.0063.
Bar 37 (Developing Bar): A failed breakout occurs. Buyers absorb supply, trap the Bar 36 sellers, and drive price higher. Bar 37 forcefully breaks above the 20 EMA and tests resistance at $0.0071.
Strategic Outlook
Price action in Flare shows that institutional capital is accumulating positions in the $0.0063 zone. If buying pressure secures a daily close above $0.0071, the market will definitively invalidate the secondary bearish structure and clear the path toward major resistance at $0.0082 (Bar 1). Conversely, losing support at $0.0063 leaves the token vulnerable to making new lows.
Disclaimer: The content of this article is strictly for informational and educational purposes. The price action and technical analysis presented do not constitute investment advice or a financial recommendation. Cryptocurrency trading carries a high level of risk; always conduct your own research before making trading decisions.

Communications Professional. Crypto Enthusiast. Economic Journalist. Bitcoiner & Altcoiner.


