

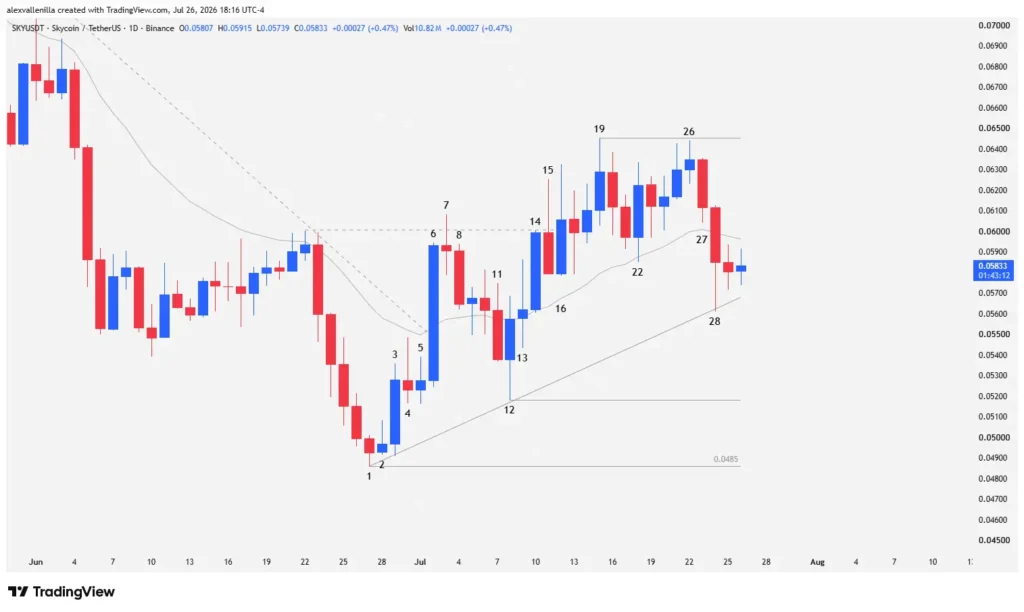
The SKY cryptocurrency records a decisive movement in its daily timeframe (1D) after halting a prolonged correction at $0.0485 (Bar 1), structuring a structural pivot that broke a 54-bar descending trendline, although persistent selling pressure at the highs tests the strength of the current micro-rising channel.
Anatomy of the Trend Reversal: From Capitulation to Institutional Momentum
The Halt of the Drop and the Trendline Break
The prior bearish structure found its definitive floor at Bar 1, where the price printed a support at $0.0485 upon completing three consecutive bearish legs across 54 bars. Decreasing bodies and high overlap highlighted the loss of momentum among sellers.
Subsequently, smart money stepped in at Bar 3 via a high-conviction bullish outside bar that exceeded prior highs. This institutional effort materialized in Bar 6, a bar that cleanly broke the descending trendline and the 20-period exponential moving average (20 EMA), placing more than half of its body above the dynamic indicator without leaving significant tails.
Key Resistance and Rejection at the Highs
Despite the initial momentum, Bar 7 adopted a doji configuration that invalidated bullish continuation, turning into a trap for buyers by failing to break resistance at $0.0600, the last relevant swing high of the prior drop.
Following a controlled pullback, Bar 12 built a higher structural support, setting the anchor for a new micro-rising channel. Aggressive buying returned in Bar 13 and Bar 14, pushing the price above the 20 EMA. However, breakout attempts in Bar 15 and Bar 16 collided with intense selling absorption, reflected in recurring upper tails.
Technical Analysis: Millimeter Reading of Price Action
Recent price behavior exposes clear exhaustion on the buyer side, outlined as follows:
Bar 19 and Bar 22: Bar 19 confirmed the prior breakout but showed weakness by becoming the sixth consecutive session with rejections at its upper part, confirming that supply absorbs demand in value areas. Bar 22 responded as an outside bullish-closing bar to halt the temporary drop.
Bar 26: Bulls attempted a new push that fizzled out into an extremely narrow range. This formation validated local resistance at $0.0645, structuring a technical double top pattern relative to Bar 19 and momentarily pushing away the possibility of targeting higher objectives at $0.0705.
Bar 27 and Bar 28: Sellers capitalized on the weakness by trapping late buyers from Bar 26. Bar 28 briefly broke the 20 EMA to the downside; however, its marked lower tail demonstrated the reappearance of buyers right above the 29-bar channel’s ascending trendline, validating the temporary validity of the structure.
The SKY cryptocurrency navigates a very tight technical definition zone. If bears manage to invalidate the current channel, the next relevant support is located at $0.0518 (Bar 12 low). Conversely, if demand regains control above the 20 EMA, bulls must overcome the Bar 19 high at $0.0645 to consolidate a structural uptrend.
Disclaimer: This analysis is for educational and informational purposes only and does not constitute financial investment advice. Cryptocurrency trading carries high levels of risk and volatility. Operating in financial markets requires proper risk management and conducting your own research before executing any strategy.

Communications Professional. Crypto Enthusiast. Economic Journalist. Bitcoiner & Altcoiner.


