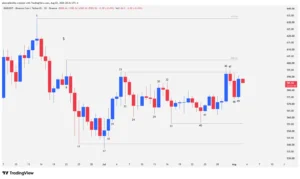
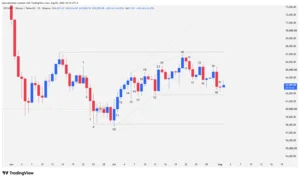
The digital finance market faces a high-tension scenario. Sky, trading in the SKY/USDT pair on the daily (1D) timeframe, shows a severe contraction after losing momentum in a long-term bullish structure that accumulated 175 bars. The buyers’ failure to conquer the all-time high set at $0.0950 triggered aggressive profit-taking that mutated into institutional capitulation, racking up a 22.68% loss over the last 12 months and a 20.98% pullback during the last quarter. At the time of writing, the SKY price barely manages to defend a meager positive year-to-date return of 1.25% so far in 2026.
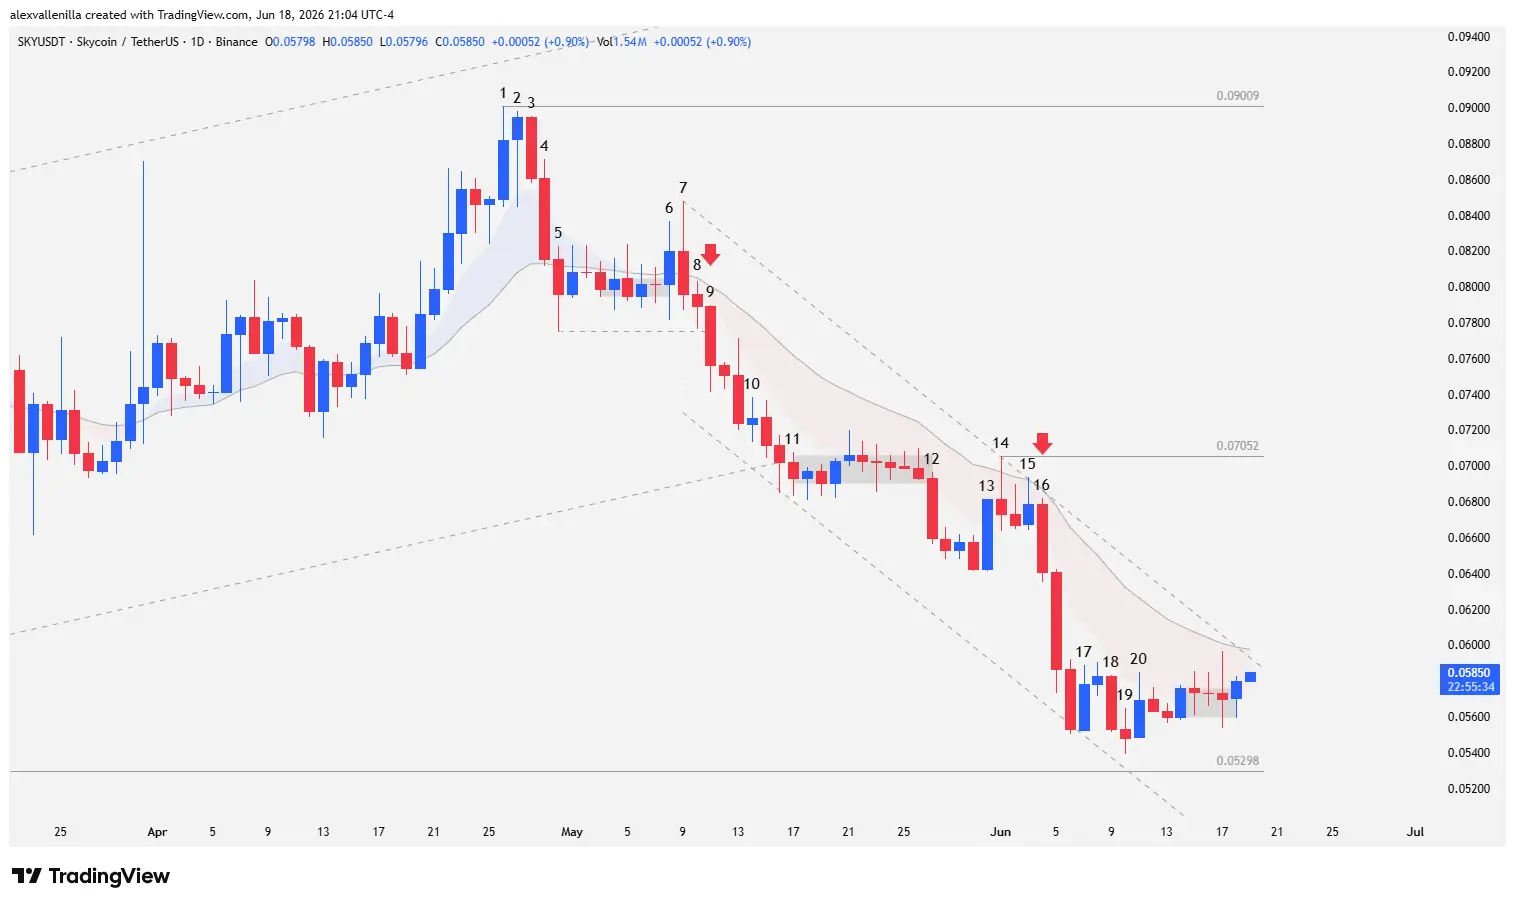
The Exhaustion of the Third Push: Failure at the Top
The technical decline of SKY/USDT began brewing from trader psychology at the upper end of the chart. The macro 175-bar uptrend failed to consolidate its continuity due to an obvious momentum failure on its third upward push, a classic mathematical sign of exhaustion in price action.
Buyers showed weakness just when the asset required higher volume to pierce historical resistance levels, opening the door to a deep structural reversal that the order flow progressively validated.
Bar 1 to Bar 3: Loss of Momentum and Initial Distribution
Bar 1: A bullish candle whose high fails to test the upper line of the long-term macro ascending channel, as well as the key resistance at $0.0950 (all-time high). It establishes a local resistance at $0.09009, setting a lower high that triggers fatigue alarms on the third push.
Bar 2: Bulls fail to provide continuity to the move. The high of this bar stays below $0.09009, confirming that buying pressure is dying out.
Bar 3: A solid but narrow-range bearish candle. It acts as a consolidating inside bar, reflecting controlled institutional profit-taking.
Bar 4 to Bar 8: Moving Average Breakouts and Market Traps
Bar 4: A high-conviction bearish bar that deepens the pullback. The low temporarily pierces the 20-period exponential moving average (20 EMA), although it closes above it, maintaining a temporary neutral-bullish bias under aggressive liquidation.
Bar 5: A formal breakout below the 20 EMA. The local low tags $0.07753. From here, the price intertwines sideways with the 20 EMA for seven sessions in a dense congestion pattern (barbed wire) with depressed volatility and predominantly bearish closes, suggesting contract distribution.
Bar 6: Volatility expansion with a bullish close over the 20 EMA, but it exhibits noticeable wicks on both ends, evidencing a fierce battle between supply and demand.
Bar 7: Bull trap. Buyers attempt to regain control but absorb a heavy flow of sell orders. The candle closes in bearish territory below the 20 EMA, leaving a long upper tail equivalent to its body size and trapping premature traders from the previous bar.
Bar 8: Bearish continuity candle. The high remains below the 20 EMA and the low pierces the lower range of Bar 7, maintaining selling pressure.
Bar 9 to Bar 12: Short Signal Activation and Structural Break
Bar 9: A bearish candle featuring a shaven head, indicating bear control from the open. By recording two consecutive lower lows under the 20 EMA and breaking the support of Bar 5 ($0.07753), it structures a high-probability Low 2 short setup. Although the subsequent bar consolidates as an inside bar without triggering the order, the following bearish outside candle pierces the low of Bar 9, activating the shorts.
Bar 10: A small doji with a bullish close that acts as a failed reversal. The rejection attracts a secondary wave of sellers to the market.Bar 11: Drastically breaks the lower boundary of the 175-bar ascending channel. The structural break invalidates the macro framework and initiates a nine-bar congestion pattern (barbed wire) hugging below the 20 EMA.Bar 12: A solid, high-conviction bearish breakout candle. Without seeking a retest of the 20 EMA, it confirms the continuation of the downward trajectory.
Bar 13 to Bar 16: Smart Money Re-Entry and Capitulation
Bar 13: A counter-trend candle with excellent bullish extension that breaks previous highs. This represents a premature attempt by demand to regain control in discount zones.
Bar 14: A pinbar-type candle with a bearish close. Its high pierces the 20 EMA and serves as a geometric anchor to project a short-term downtrend line. By failing to deliver upside continuity, it invalidates the structure of Bar 13, transforming it into a failed reversal.
Bar 15: Bulls attack the 20 EMA and the top of the descending channel, but supply absorbs the volume. The close prints below both resistances, invalidating the apparent weakness of the previous bearish inside range.
Bar 16: Injection of institutional volume (smart money). Bears punish the lack of buying strength with an extended-range candle that breaks the low of Bar 13. This triggers a stop-loss cascade from lagging buyers. The acceleration gives rise to a second bearish candle with thematic/climax characteristics, followed by a third candle of capitulation and panic selling. However, the low of this freefall fails to touch the key macro support located at $0.05298 (the control point of the previous 175-bar trend), denoting exhaustion in selling pressure.
Bar 17 to Bar 20: Defense at Key Support Zone
Bar 17: A bullish reversal candle. Despite not exceeding the previous high, its low registers a subtly higher floor, which denotes the presence of buyers defending the $0.05298 support block.
Bar 18: An institutional bearish intent candle seeking to sweep lower liquidity. It pierces the low of Bar 17 but fails again to reach or test the key support at $0.05298.
Bar 19: A small doji with a bearish close and zero net progress. The low keeps floating above critical support.
Bar 20: A bullish candle that exceeds the high of Bar 19. Price action subsequently enters a phase of sideways congestion and high volatility with no defined direction, trapped within an extended short-term downward move.
Projection Scenarios: Key Levels for the SKY Price
Price action for SKY/USDT maps out a mature two-legged downward structure within a short-term descending channel. Bears continue to dominate market sentiment after fracturing the main uptrend.
For the downtrend to extend its dominance in search of new lows, supply must decisively break the key support at $0.05298. If volume breaks this level, the next technical target via order flow sits at $0.03998.
Conversely, if the bears’ repeated failure to hit macro support validates a floor, demand needs to push the price above the first major resistance at $0.07052, an indispensable threshold to neutralize the bearish bias and open the path back toward the highs of Bar 7 and Bar 1.
Disclaimer: The analysis presented in this article is for informational and educational purposes only, based on price action methodology. It does not constitute, under any circumstances, investment advice, trading recommendations, or financial counseling. Cryptocurrencies are highly volatile assets, and trading digital assets carries a substantial risk of capital loss.
Communications Professional. Crypto Enthusiast. Economic Journalist. Bitcoiner & Altcoiner.