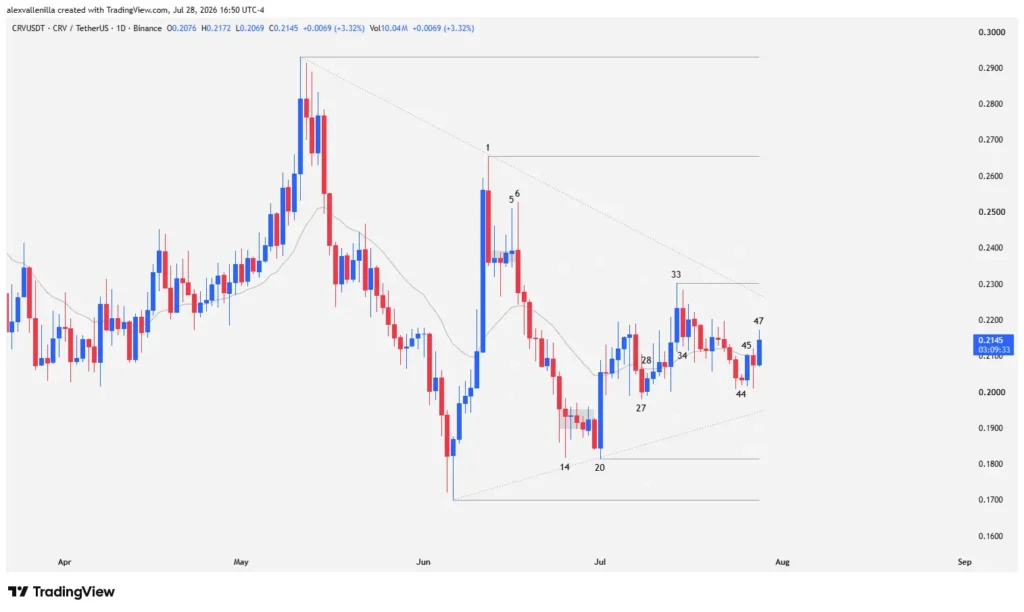
Curve DAO Token (CRV) is trading in a high-compression technical zone on its daily timeframe (1D), recovering from a bull trap that drove the price down to the $0.1700 support level. The confluence between lower highs and higher lows forms a symmetrical triangle pattern, with the 20-period exponential moving average (20 EMA) acting as the dynamic price axis. Buyers are holding their ground with heavy absorption at the bottom, while sellers apply pressure at intermediate resistance levels like $0.2303, setting the stage for an explosive breakout move.
Market Dynamics: Supply Absorption and Overhead Resistance
The DeFi market is undergoing a structural consolidation phase in CRV. After generating a climactic push that culminated in a bull trap at $0.2931, order flow shifted into extreme indecision. Institutional players and day traders are closely monitoring price action, which displays repeated attempts by bulls to regain the upper hand.
This dynamic creates clearly defined trading zones. The failure of sellers to push the price below the critical $0.1700 level reflects solid buying absorption. Meanwhile, key overhead resistance at $0.2655 marks the definitive boundary between the macro downtrend and the start of a new medium-term bullish market structure.
Detailed Price Action Technical Analysis (1D)
Bar-by-bar analysis reveals the psychological battle between supply and demand throughout the current structure:
Congestion Phases and Control Bars
Bar 1: High-conviction bearish pullback bar. It appears after a vertical bullish impulse driven by smart money exhausted buyers. Its high ($0.2655) sets a lower high against the prior $0.2931 resistance and serves as the anchor for the main downtrend line. Following this bar, price enters a micro-congestion range.
Bar 5: Failed bullish breakout attempt. Buyers try to break out of the micro-range but form a doji with a prominent upper tail, keeping the real body within the range of Bar 4.
Bar 6: Volatility spikes as a bearish outside bar breaks congestion to the downside. Price approaches the 20 EMA without penetrating it. Its lower high relative to Bar 1 confirms seller dominance and starts a mini bear channel.
Floor Absorption and False Breakdown
Bar 14: A hammer bar whose close sits above the low of Bar 13, stopping the selling momentum. Lower wicks across bars 13, 14, and 15 signal aggressive supply absorption at the lows. The low of Bar 14 respects key support at $0.1700 by printing a higher low.
Bar 19: False bearish breakdown of the subsequent compression pattern. Sellers print a tiny-range bar whose low holds comfortably above $0.1700 and the low of Bar 14, invalidating any structural threat.
Bullish Reaction and Triangle Formation
Bar 20: Strong bullish conviction entry via a wide-range outside bar with negligible wicks. It traps the sellers from Bar 19, pierces the 20 EMA to close above it, and clears the highs of Bar 13. Its higher low acts as the anchor point for the ascending trendline of the triangle.
Bars 27 and 28: A two-bar pullback (Bar 27) fails to find downside continuation. Bar 28 responds as a bullish inside bar, confirming the pullback failure and projecting a two-leg bullish structure from the low of Bar 20 to Bar 33.
Bar 33: Breakout above the 20 EMA that shows signs of exhaustion due to its long upper wick. It prints a lower high at $0.2303 relative to bars 1 and 6, solidifying the upper boundary of the compressed triangle alongside a flat 20 EMA.
Bar 34: Bearish pullback inside bar where sellers try to regain control, absorbing much of Bar 33’s body and kicking off a weak, heavily overlapping two-leg drop.
Current Market State (Bars 44 to 47)
Bar 44: Tiny-bodied doji signaling the end of the two-leg bearish push. Its low holds above the low of Bar 20.
Bar 45: Bullish reversal that successfully tests the 20 EMA.
Bar 47 (Developing): Shows a pullback failure from Bar 46. Price crosses above the 20 EMA again, targeting the 79-bar downtrend line and the $0.2303 resistance level (Bar 33 high).
Market Outlook
CRV’s macro structure displays clear accumulation within a symmetrical triangle. If bulls manage to break above the Bar 33 resistance ($0.2303) and the main downtrend line with high volume, they will pave the way toward key resistance at $0.2655. Reclaiming that level will invalidate the major downtrend. Conversely, a rejection at the top of the triangle leaves the asset vulnerable to retesting support at Bar 20 and the pivot zone at $0.1700.
Financial Disclaimer: This content is presented strictly for educational and informational purposes. It does not constitute financial, investment, or trading advice. Always conduct your own research and consult a licensed professional before making any investment decisions.

Communications Professional. Crypto Enthusiast. Economic Journalist. Bitcoiner & Altcoiner.