The crypto market is testing short-term traders’ liquidity once again. This time, Jupiter (JUP), one of the pillars of the DeFi ecosystem on Solana, stars in a dynamic technical setup marked by breakout failures, slowing sell pressure, and a falling wedge formation with clear bullish implications.
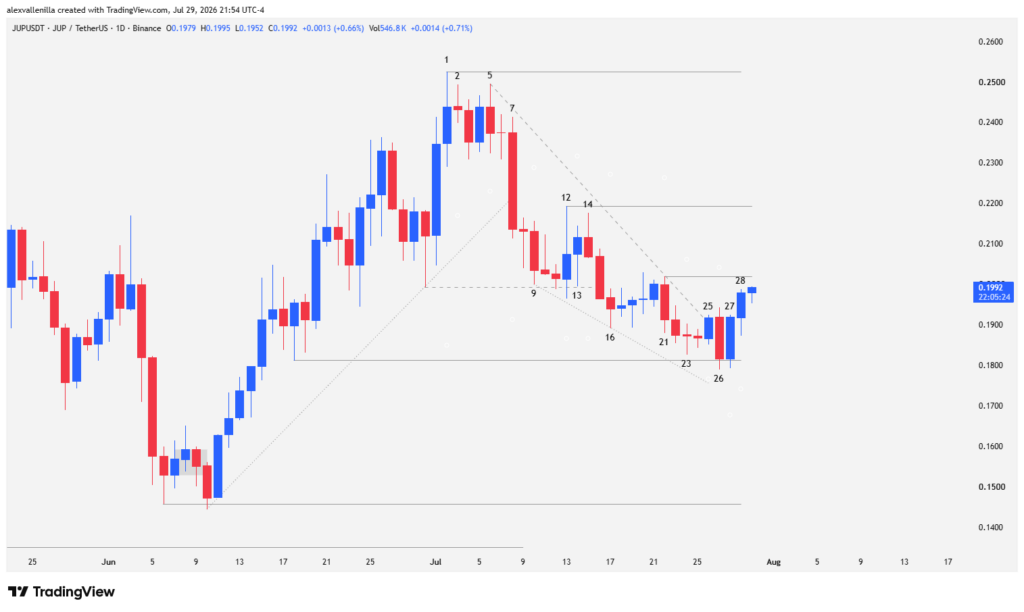
After a failed attempt to attack the macro resistance at $0.2766, JUP suffered a sharp pullback that sent it back to critical demand zones around $0.1812. Price action currently signals operational exhaustion among institutional bears, sparking debate over whether we are seeing a simple pause within the broader 370-bar downtrend or the seed of a structural shift.
Macro Structure: The $0.2766 Resistance and the Weight of the Broader Trend
To understand JUP’s current position, we must put its higher time frame into context. The asset trades within a major bearish structure spanning over 370 bars.
Buyers mounted a secondary attempt to regain control through a 28-bar counter-trend push. However, selling pressure at the top neutralized the bullish offensive once again, triggering a wave of liquidations that completely reshaped order flow in the recent microchannel.
The Breakdown at the Top: From Bar 1 to Bar 7
Bar 1: Hits immediate resistance at $0.2525, falling short of testing $0.2766. This bullish candle forms a prominent upper wick following a prior climax bar at the peak of a 28-bar push, establishing a clear local top.
Bar 2: Prints as an inside Doji bar. By failing to clear Bar 1’s high, it cancels bullish momentum and signals a slowdown with its tiny body.
Bar 5: Prints a high that creates a double top with Bar 2, failing to test Bar 1’s high. This candle forms the third component of a micro-range pattern that compresses price at the top.
Bar 7: Buyers’ inability to push higher triggers an aggressive response from bears. Bar 7 emerges as a strong conviction candle: it breaks Bar 6’s low, sweeps the micro-range liquidity, and closes below the 28-bar bullish trendline. This move confirms a bull trap at Bar 1 and destroys the secondary bullish structure.
The Downward Slide and Loss of Key Levels: From Bar 9 to Bar 16
Bar 9: Delivers bearish follow-through to Bar 8, confirming the breakdown of the ascending microchannel.
Bar 12: Bulls attempt to defend local support at $0.1993. However, supply absorbs demand and produces a bearish close with a massive upper wick, setting a relevant new local resistance at $0.2193 within a 20-bar downward leg.
Bar 13 and 14: Bar 13 reacts as a hammer at $0.1993, but the bounce attempt in Bar 14 fails to test Bar 12’s high. Finally, Bar 15 breaks through the $0.1993 support, invalidating any recovery attempts.
Bar 16: Bar 16’s low, aligning with Bar 9’s low, allows us to plot the base of a descending channel. Price shows early signs of deceleration at its lows, forming a falling wedge structure alongside the upper trendline (connecting the highs of Bar 5 and Bar 21).
Seller Exhaustion and Reversal Pattern: From Bar 21 to Bar 28
Bar 21: Sellers initiate another push downward after four bars of bullish indecision. The high of this candle establishes key resistance at $0.2020, acting as the last relevant high of the 20-bar microchannel.
Bar 23 and 24: Bar 23 is a Doji candle whose low respects local support at $0.1812. The progressive shrinking of candle bodies across bars 21, 22, and 23 reveals a clear pattern of deceleration. Bar 24 consolidates inside without touching that support level.
Bar 25: Buyers launch a counterattack. With a solid body and almost no wicks, Bar 25 breaks the 20-bar descending trendline, officially halting the selling streak.
Bar 26 and 27: Bar 26 attempts a fakeout by piercing the $0.1812 support, but price reclaims the level and closes above it, marking a failed breakout. Bar 27 forms a Tweezer Bottom pattern alongside Bar 26, trapping late sellers.
Bar 28: Bullish confirmation. Bar 28 breaks above Bar 27’s high, validates Bar 26’s breakout failure, and resumes the upside expansion to test upper resistance levels.
Market Outlook: Critical Levels to Watch
Current order flow puts buyers in an active recovery phase. To confirm a sustainable trend reversal, price must reclaim two primary operational hurdles:
If buyers break and consolidate above $0.2193, they will confirm that the $0.1812 bottom serves as a higher low relative to $0.1457. This technical development would reopen the path toward the critical $0.2766 zone. Conversely, a rejection at $0.2020 keeps the risk of retesting $0.1812 support alive.
Jupiter’s (JUP) price action offers a masterclass in supply and demand dynamics. The falling wedge pattern, paired with the breakout failure at $0.1812 and confirmation on Bar 28, gives bulls a tactical window to redefine market structure over the short term.
Disclaimer: This analysis is for informational and educational purposes only and does not constitute investment advice or a financial recommendation. Cryptocurrency trading involves a high level of risk. Always do your own research (DYOR) before making operational decisions.

Communications Professional. Crypto Enthusiast. Economic Journalist. Bitcoiner & Altcoiner.