Ethereum Name Service and decentralized finance are resetting their pieces. Ether.fi (ETHFI) is navigating a critical phase on its daily (1D) timeframe. After executing a solid two-leg bullish pattern from the critical $0.2660 zone, price action is showing severe deceleration and a substantial surge in volatility. Traders face the classic narrative of supply absorption at higher levels, where the inability to break through key resistance at $0.4790 threatens to turn the recent bullish structure into a bull trap.
Market Structure and Order Flow in ETHFI
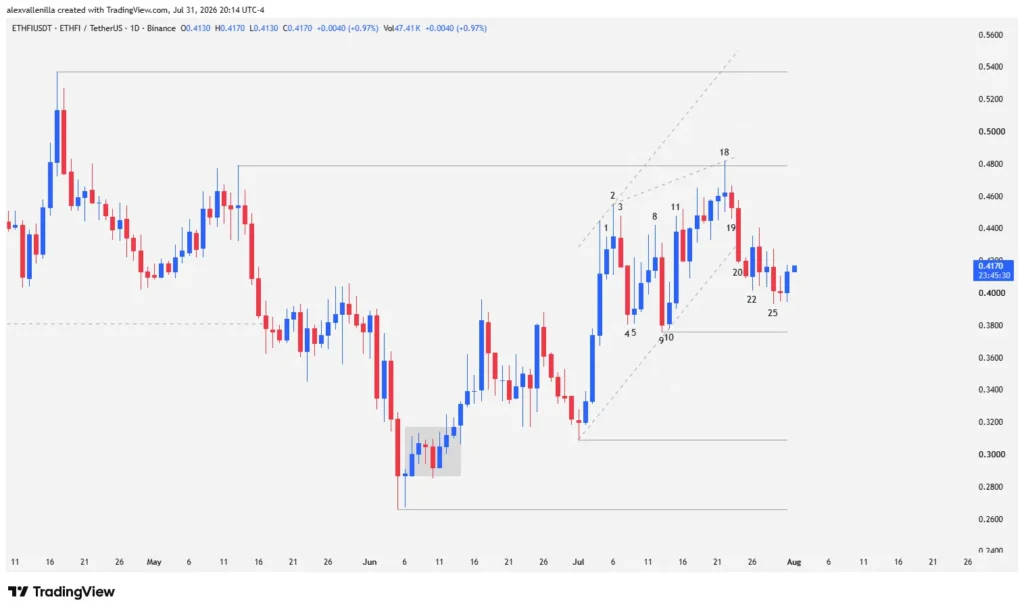
The daily chart reflects an institutional tug-of-war marked by clear expansion and contraction phases. The move that propelled ETHFI from $0.2660 established its first major resting zone at $0.3090, a level that served as a springboard to develop the second bullish leg.
However, recent behavior exhibits signs of structural exhaustion. The formation of a rising wedge, bounded by lower momentum highs and heavy overlaps, warns that buyers are losing traction while supply takes control near critical resistance.
Phase 1: Initial Consolidation and Supply Rejection (Bars 1 to 8)
Bar 1 and Bar 2: Bar 1 acts as an inside bar compressing price after a prior bullish impulse. Bar 2 (a 2i type) expands volatility but introduces indecision. Its high serves as the anchor for the top of the 23-bar bullish channel.
Bars 3 and 4: Bar 3 fails to test the high of Bar 2, closing as a bearish inside bar and confirming a temporary pause in momentum. Bar 4 validates this pullback with a strong bearish close.
Bar 5: Acts as a two-bar failed pullback. It prints a higher low relative to the $0.3900 support (the origin of the 23-bar trendline), temporarily halting the correction.
Bar 8: Prints a third inverted hammer with a bullish close off the Bar 4 low. It stacks four consecutive candles with extended upper wicks, highlighting strong demand absorption by sellers at higher levels.
Phase 2: Support Breakdown and Buyer Response (Bars 9 to 11)
Bar 9: A high-conviction supply candle. Its body covers nearly the entire range, slightly penetrating the lows of Bars 4 and 5 to establish a new pivot support at $0.3760.
Bar 10: Negates the bearish continuation of Bar 9, defending the $0.3760 level and sparking an immediate reversal.
Bar 11: Buyers react with a strong marubozu candle that invalidates Bar 9. It breaks above the high of Bar 9 and clears the high of Bar 8, confirming the start of the second bullish leg within the broader structure.
Phase 3: The Rising Wedge and Bearish Breakdown (Bars 18 to 23)
Bar 18: A doji with a prominent upper wick halts momentum just below key resistance at $0.4790. Inter-bar overlapping and upper wicks at the top of the mini-channel culminate in a rising wedge pattern.
Bar 19: A pullback bar confirming loss of demand momentum, though it remains overlapped within the range of Bar 18.
Bar 20: Supply steps in aggressively. A wide-range bearish candle aggressively breaks the lower trendline of the bullish channel.
Bars 22 and 23: Bar 22 (an outside bar) creates volatility, but bullish intent fails. Bar 23 maintains the congestion pattern; heavy overlapping and wicks on both ends reflect deep indecision following the channel breakdown.
Two Scenarios for ETHFI: What to Expect NOW?
Bullish Scenario (Structure Validation): If demand holds support at $0.3760 (the low of Bar 9), price will build a base to retest resistance at $0.4790. A clean, sustained breakout above this level would confirm entry into a medium-to-long-term bullish structure.
Bearish Scenario (Trap Confirmation): Losing pivot support at $0.3760 will invalidate the recovery attempt. This will trigger a bearish acceleration toward support at $0.3090, framing the rally to Bar 18 as a classic bull trap.
ETHFI is locked in a fierce battle between selling pressure from the rising wedge and buyer defense at the $0.3760 pivot support. The upcoming daily closes will determine whether we are witnessing a simple technical pause to reaccumulate supply or confirmation of a deep correction across derivatives and Liquid Restaking markets.
Disclaimer: This article is strictly for informational and educational purposes. It does not constitute financial advice, an investment recommendation, or an official securities analysis. Trading cryptocurrencies carries a high risk of capital loss. Always conduct your own research.

Communications Professional. Crypto Enthusiast. Economic Journalist. Bitcoiner & Altcoiner.