

The end of capitulation? After accumulating year-to-date losses exceeding 50%, ETHFI consolidates a structural shift on its daily chart. Supply absorption at historical lows and the breakout above the 20 EMA open the door for a macro reversal that millennial investors are already monitoring closely.
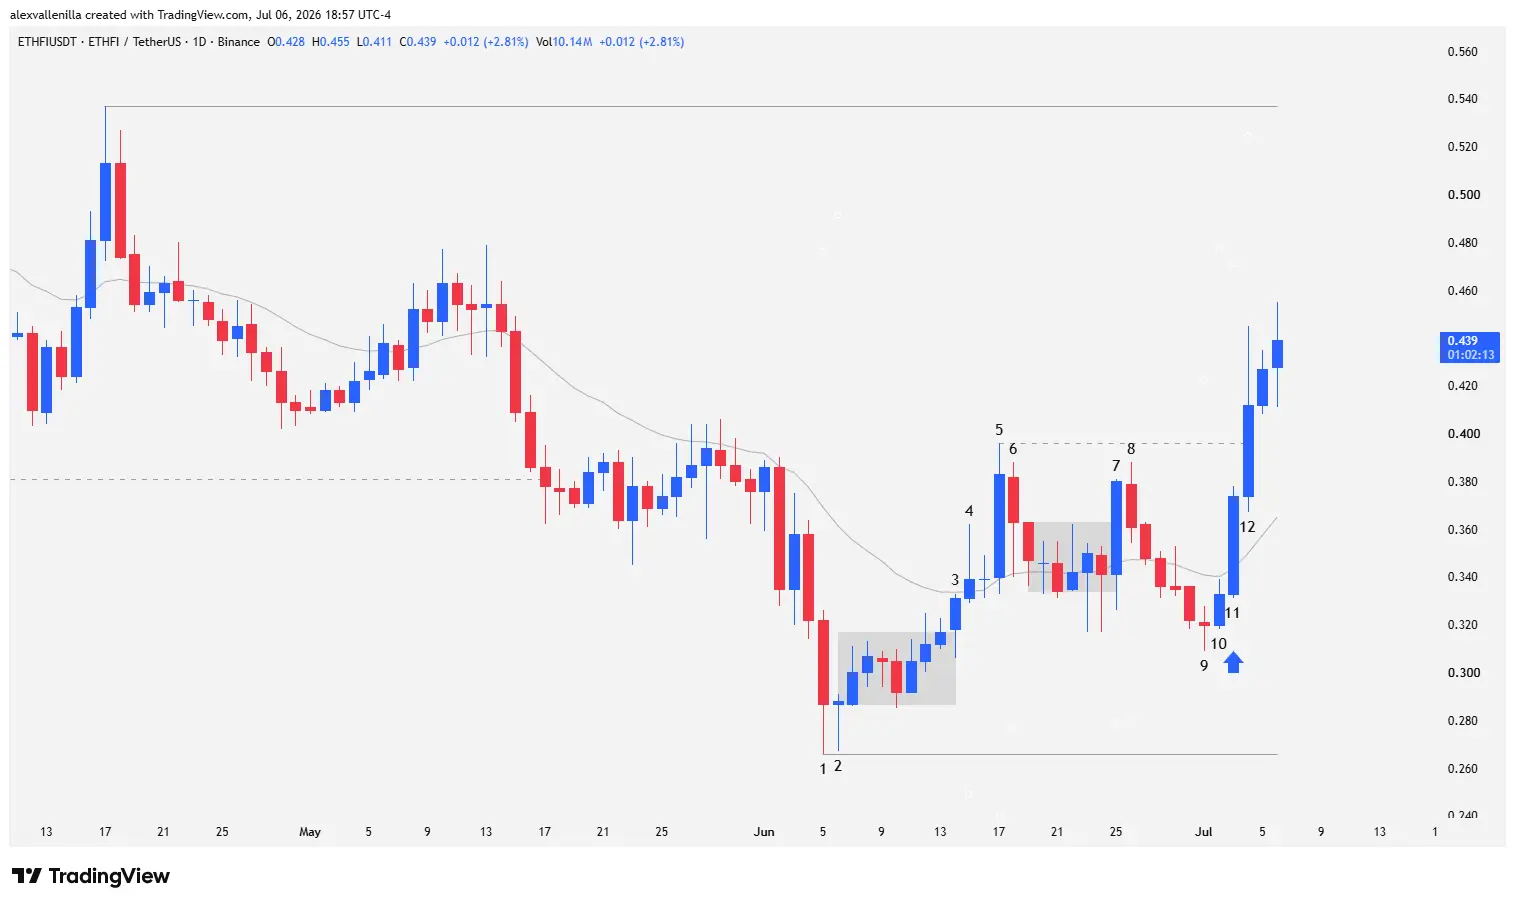
The decentralized finance (DeFi) market and technological governance protocols show a highly relevant shift in dynamics. The native token of ether.fi, ETHFI, has just invalidated the lower highs sequence it suffered on its 1D time frame. The definitive breakout above the local resistance at $0.396 and the solid current price reactivate institutional risk appetite for blockchain infrastructure assets.
Although the token accumulates a contraction of 36.19% year-to-date in 2026 and a 52.90% loss over the last 12 months, the short-term outlook experiences a drastic turnaround. The cryptocurrency registers a 30.65% rally in the last week and extraordinary gains of 52.96% during the last month. This notable acceleration in buy order flow suggests that the prolonged underground accumulation phase is about to end, giving way to a potential medium- and long-term bullish restructuring.
Chart Anatomy: Bar-by-Bar Price Action Reading
To understand the psychology of supply and demand without the noise of lagging indicators, we analyze in detail the bar sequence that determined this direction change in the ETHFI/USD pair:
Bar 1: After a severe and mature primary bearish trend spanning 275 bars, buyers stop the bleeding and establish critical support at $0.266. Although selling pressure was extreme, the price fails to test the absolute all-time low located at $0.085. The presence of a lower tail covering almost 30% of the bar’s total range reveals aggressive supply absorption by bargain hunters.
Bar 2: The market prints a bearish pinbar inner bar. However, buyers react fiercely, registering a lower wick significantly larger than its tiny body, confirming that institutional buy orders are absorbing the remaining weak hands. Following this event, the price enters a sideways congestion phase below the 20-period Exponential Moving Average (20 EMA) and above the newly discovered support.
Bar 3: Bulls show initiative, breaking the congestion pattern of previous sessions and directly testing the 20 EMA.
Bar 4: Buying pressure persists and manages to breach the 20 EMA. However, bears defend the upper zone by printing a very pronounced upper tail relative to the bar’s body, exposing widespread profit-taking at the dynamic resistance.
Bar 5: After a brief and necessary price consolidation, strong hands enter the market with a robust bullish conviction bar. Institutional capital validates the move by closing above the 20 EMA and surpassing the previous high. This bar establishes local short-term resistance at $0.396.
Bar 6: A bearish inner bar appears, halting the momentum of bar 5. From this point on, price gets locked into a severe congestion phase known as barbed wire, completely intertwining with the 20 EMA line through bars with extremely small bodies and tails at both ends, denoting a total absence of direction.
Bar 7: Bulls attempt to shake off the lethargy and break the sideways pattern, maintaining a close above the 20 EMA. However, the bar fails to test the high of bar 5, which the market interprets as a weak breakout and an evident loss of momentum.
Bar 8: Bears exploit the weakness, rejecting the breakout confirmation and triggering a technical pullback. The sessions following bar 8 develop small, narrow-range candles, movements characteristic of a passive reaccumulation phase.
Bar 9: The market designs a minuscule doji bar. The key data point is that its low fails to test the support at $0.266, extinguishing bearish momentum. By registering a Higher Low relative to bar 1, the price officially interrupts the historical sequence of lower lows governing the macrostructure.
Bar 10: Buyers halt the slight drop and trap late sellers from bar 9, forcing a short squeeze.
Bar 11: Institutional money reappears with strength via a solid bullish conviction bar. They violently break above the 20 EMA and achieve a higher close, emitting a highly potent technical buy signal, even for a counter-trend move.
Bar 12: This candle provides immediate bullish continuity to the institutional breakout of bar 11. The price decisively pierces local resistance at $0.396. This breakout expands the buy order flow and clears the path to target the critical technical level at $0.537.
Macro Projection: Pre-Bull Market Scenario Rules
The current technical structure of ETHFI presents a critical transition scenario. Establishing a higher low on bar 9 and the subsequent breach of local resistance confirm the first solid attempt to reverse the primary bearish trend.
For analysts to certify entry into a pre-bull market, the price must target, break, and consolidate above the last relevant lower high of the bearish trend, located at $0.537. If price action conquers this objective, the macro bearish structure will be completely compromised, establishing the foundations for a new structural bullish trend.
Should sell orders dominate the upper zone and reject the price at $0.537, bulls count on an operational safety net: the dynamic support of the 20 EMA, currently located at $0.365, which would act as the primary cushion before invalidating the reversal structure.
The breakout of local resistance at $0.396 completely reconfigures the liquidity map for ETHFI, forcing institutional capital to re-evaluate their hedging positions.
Disclaimer: The content of this article is presented solely for informational and educational purposes. It does not constitute, nor should it be interpreted as financial advice, investment recommendation, or an invitation to trade digital assets. Cryptocurrency trading involves a substantial risk of capital loss.

Communications Professional. Crypto Enthusiast. Economic Journalist. Bitcoiner & Altcoiner.


