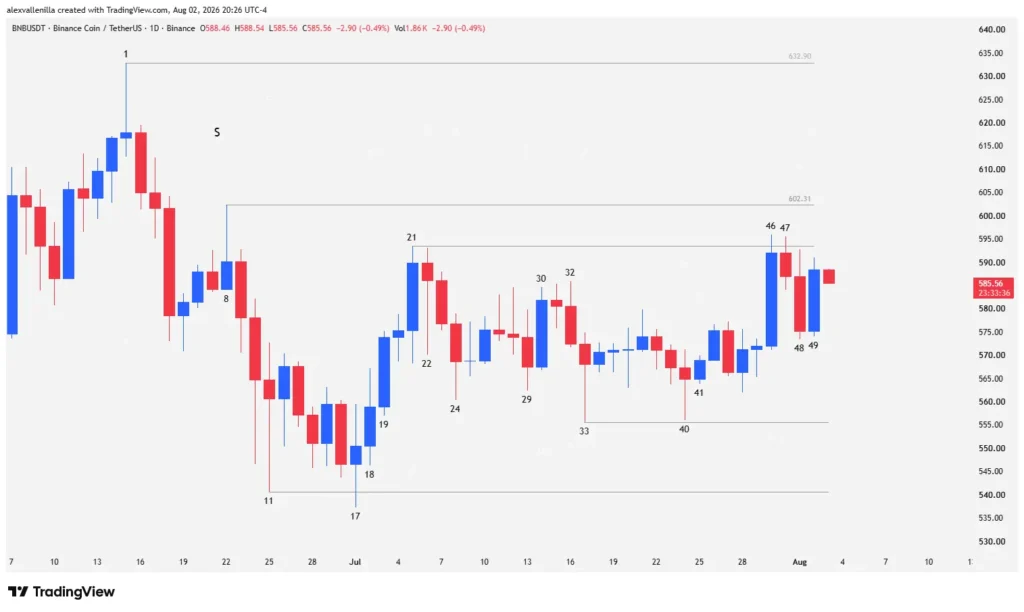
The Binance Coin (BNB) market on its daily timeframe paints a high-tension technical scenario during the final sessions of 2026. Following a prolonged bearish cycle that hit highs at $745.74, the price found a critical defense zone. Through institutional absorption and the formation of double-bottom structures at bar 33 and bar 40, buyers defend key support levels while evaluating the annular resistance at $593.47, structuring a sideways market with clear accumulation undertones.
Market Pulse: Between Support and Resistance
Buyer Defense in Critical Zones
Price action on the daily chart reflects a constant struggle between macro bearish pressure and institutional capital intervention at the base of the chart. Seller exhaustion shows up as each bearish extension attempt gets repelled by long absorption tails, proving that demand aggressively absorbs available supply at lower levels.
Consolidation and Accumulation Range
The current formation responds to a compression pattern where the price strictly respects the limits set by smart money. Support and resistance zones act as magnets for the price, limiting directional volatility while the next supply and demand imbalance takes shape.
Technical Analysis: Advanced Price Action Reading
The bar-by-bar breakdown reveals the exact psychology of market participants on the BNB daily chart:
Bar 33: Bears try to accelerate the drop following the previous pullback of bar 32. However, the price prints a hammer with a prominent lower tail, evidencing strong supply absorption by buyers. The low sits above the critical support of $540.60.
Bar 40: Following a failed bullish reversal attempt, selling pressure reappears without success. The resulting candle prints as a hammer again with an extensive lower tail relative to its body. Its low practically mirrors that of bar 33, setting up a double bottom or a bullish flag with a double bottom.
Bar 41: An inside reversal bar halts volatility, consolidating the price and denying the bearish continuation initiated in bar 40.
Bar 46: Following a micro-range across the previous four bars, buyers surprise the market with a high-conviction, wide-range bullish bar, featuring a minimal lower tail and an almost non-existent upper tail. Although it slightly punctures the zone, it fails to close above the high of bar 21 or break the resistance at $593.47. This move establishes a double top and a bearish flag that, combined with the previous double bottom, defines a sideways range with support at $555.59 and resistance at $593.47 over 28 bars, suggesting an accumulation zone as long as the support of bar 11 ($540.60) holds.
Bar 47 and 48: Bears structure a pullback via an inside bar with no bullish continuation (Bar 47), followed by an abrupt drop that confirms that move in bar 48.
Bar 49: Buyers immediately halt the drop, invalidating the bearish continuation with a powerful reversal bar that completely overlaps the body of bar 48. Despite being a high-conviction buying inside bar, momentum cuts short before reaching the high of bar 21.
In a macro context, this technical behavior reflects a bearish slowdown following the rejection at $745.74. The repeated appearance of bullish bars driven by smart money in contrast to weak pullbacks confirms institutional accumulation at the base of the move. If bulls clear the resistance of bar 21 and $602.31, BNB initiates the building of a higher-timeframe bullish structure. Otherwise, the $555.59 and $540.60 levels act as protective price fences.
Price action in Binance Coin demonstrates that the main bearish structure loses steam against methodical accumulation by institutional capital. Monitoring the current range limits remains decisive to anticipate the breakout dictating the asset’s medium-term technical course.
Disclaimer: This article is for educational and informational purposes only. It does not constitute financial advice or an investment recommendation. Cryptocurrency trading carries a high risk of capital loss; trade at your own risk.

Communications Professional. Crypto Enthusiast. Economic Journalist. Bitcoiner & Altcoiner.