

Binance Coin (BNB) is waging a decisive battle for control of the price structure on the daily (1D) chart. After experiencing a severe crash from the macro resistance zone at $745, the cryptocurrency found a solid containment zone at $541, where demand printed a double bottom pattern. Currently, the asset is digesting selling pressure within a tight sideways congestion range bounded by local resistance at $593 and support at $560, while the 20-period exponential moving average (20 EMA) loses its downward slope and flattens out completely.
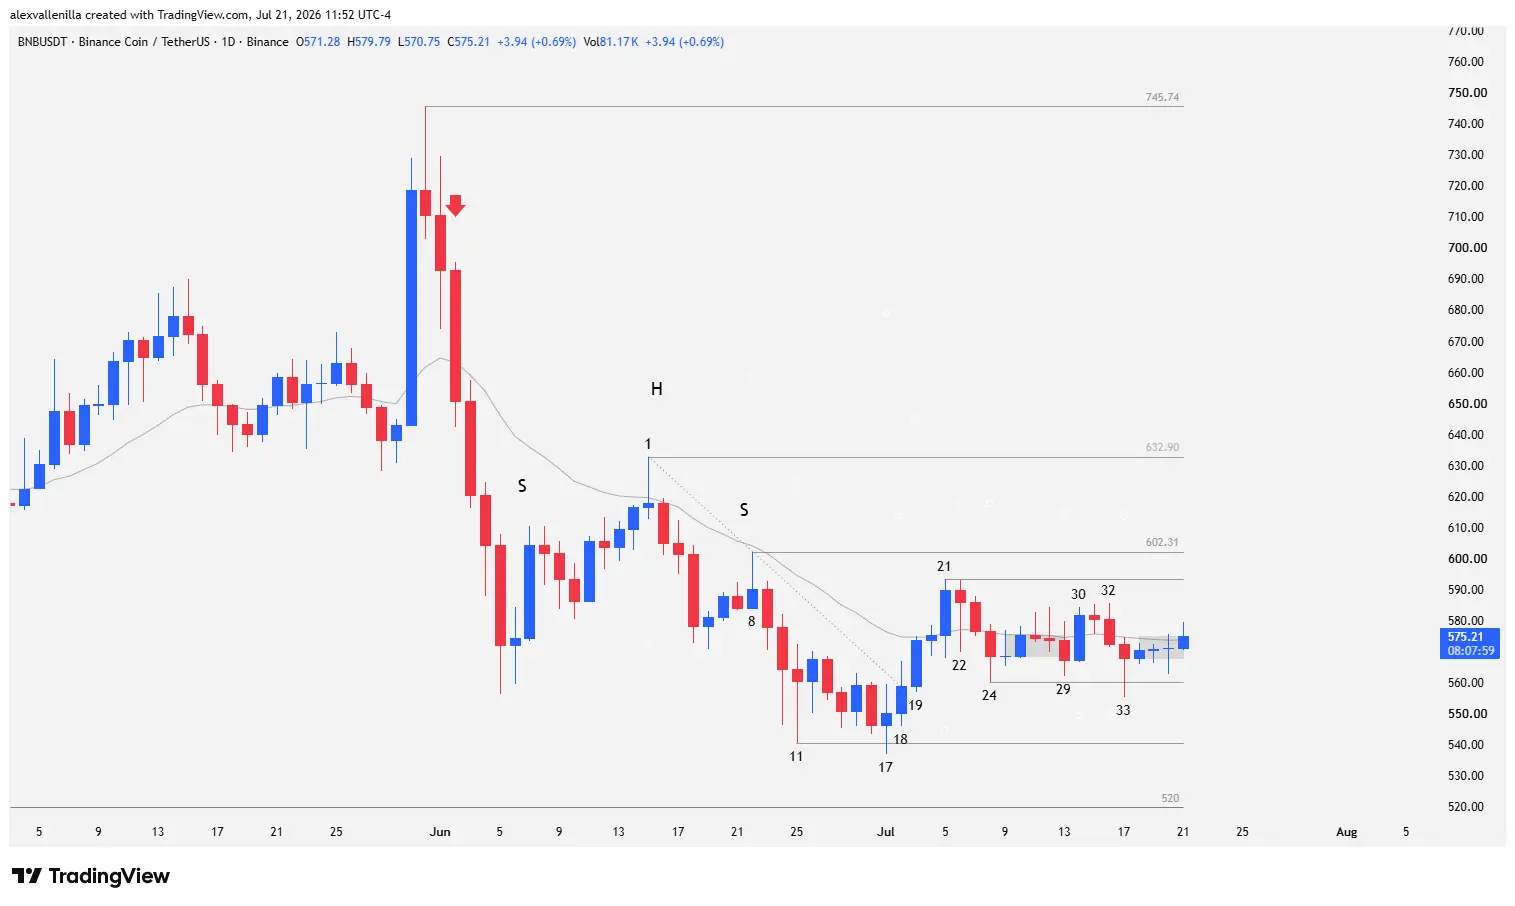
So far in 2026, BNB is down 23.98%. However, analyzing recent sessions reveals a drastic deceleration in bearish momentum, limiting losses over the past month to a modest 2.16%. This slowdown suggests buyers are absorbing available supply near key support levels, setting the stage for an eventual test of upper resistance levels.
Technical Price Action Analysis: Detailed Bar-by-Bar Breakdown
Order flow on the daily chart reflects a gradual transition from an impulsive bearish move into a phase of volatility compression and temporary equilibrium.
Bearish Exhaustion and Initial Reversal (Bars 17 to 19)
Bar 17 marks a turning point in the structure. Sellers attempt to pierce prior support at $541—established by the low of bar 11—but the attack fails. Although the low of bar 17 slightly sweeps the previous level to form a technical double bottom, bulls react in time, printing a Doji candle that closes above support. Despite continuing the move from bar 16, the inability to consolidate a close below $541 exposes supply exhaustion.
This loss of momentum stands out when comparing the bearish leg (the 17-bar descending channel) with the previous one. The first leg projected a vertical drop with six consecutive red candles from $745. In contrast, this second leg shows clear deceleration. Previously, bars 10 and 11 displayed Pinbar patterns with extended lower tails and complete overlap between them, confirming institutional demand was actively absorbing sales in that area.
Bar 18 confirms the reversal by logging a higher high and higher low than bar 17, though it fails to close above the previous high. Buyers immediately accelerate in bar 19, successfully breaking the short-term bearish microchannel and cleanly piercing the 20 EMA.
Friction at Resistance and Supply Absorption (Bars 20 to 24)
Following a pause in bar 20, bar 21 extends above the 20 EMA. However, demand lacks the strength required to test key resistance at $602, a price associated with the right shoulder of an unconfirmed Head and Shoulders (H&S) chart pattern. The lack of momentum halts the advance at $593, establishing a local ceiling.
Bar 22 responds as an inside consolidation bar. Bears stall the rally but fail to mount a forceful counterattack. This leads bar 24 to test a bearish breakdown below the 20 EMA. Nevertheless, the narrow range of bars 22, 23, and 24 betrays a lack of selling conviction. Bar 24 prints a significant lower wick, proving buyers are taking entries at higher prices while defending a higher low relative to bar 17.
Congestion Phase and Inability to Break Out (Bars 25 to 34)
Starting at bar 25, price enters a severe congestion pattern that constantly intertwines with the 20 EMA, which lies completely flat. This behavior neutralizes the threat of invalidating the H&S pattern, leaving price trapped within a reduced fluctuation band between $593 and $560.40.
Bar 29: Bears attempt to break out of congestion to the downside but print a tiny candle with wicks on both ends, revealing a trap without operational reliability.
Bar 30: Buyers capitalize on the bearish failure of bar 29, driving price above the 20 EMA, exceeding the prior high and trapping short sellers. However, the high of bar 30 falls short of bar 21’s high ($593), demonstrating that demand still lacks the volume needed to push for macro pattern invalidation.
Bars 31 and 32: Bar 31 displays a tiny bearish close, followed by a slight penetration below the 20 EMA in bar 32, confirming a new pullback due to lack of bullish follow-through.
Bar 33: Sellers press the floor of the structure and temporarily pierce local support at $560.40. However, buyers react aggressively, printing a Pinbar candle with a prominent lower wick that reaffirms absorption at this level.
By bar 34, BNB has spent four consecutive sessions compressing in a tight range, clinging to the neutral axis of the 20 EMA.
Macro Structure and Breakout Scenarios
BNB price action remains bounded by a consolidation zone over the last 16 bars. The bounce off the $540.60 double bottom neutralized the immediate risk of a collapse toward historical macro support at $520, a critical low untested for 470 bars.
The downward move from $745 represented a failed attempt to break the long-term primary downtrend (278 bars). If buyers manage to overcome resistance at $612 (bar 8 high) and consolidate closes above $602, triggering seller stop-loss orders will inject the necessary fuel to target $632 (head of the H&S formation). A confirmed breakout above $632 would invalidate the larger bearish structure and signal the start of a new medium-term bullish phase. Conversely, an inability to clear $602 will keep bears pressing down on support levels at $560 and $541.
BNB is undergoing a period of volatility compression where selling pressure shows clear signs of exhaustion around $540. The bears’ inability to break key supports suggests the market is building energy above the 20 EMA. The next expansionary move will depend on the bulls’ ability to break through the resistance band between $602 and $612.
Disclaimer: This analysis is strictly for informational and educational purposes regarding price action and technical analysis in financial markets. It does not constitute investment advice, financial recommendations, or a solicitation to buy or sell digital assets. Cryptocurrencies are high-risk, highly volatile assets; conduct your own research before making operational decisions.

Communications Professional. Crypto Enthusiast. Economic Journalist. Bitcoiner & Altcoiner.


