The crypto market gives no quarter, and price action demands a pinpoint read. During recent sessions on the Zcash (ZEC) daily chart, institutional participants—the smart money—wage a pitched battle for control of the order flow. After clearing critical technical barriers and absorbing a deep correction, the overall structure keeps the bullish tension alive. Are we witnessing the prelude to a new rally or the ultimate collapse of the trendline? Bar-by-bar breakdown reveals the true psychology behind the candles.
Anatomy of the Impulse and the Rejection at the Peak
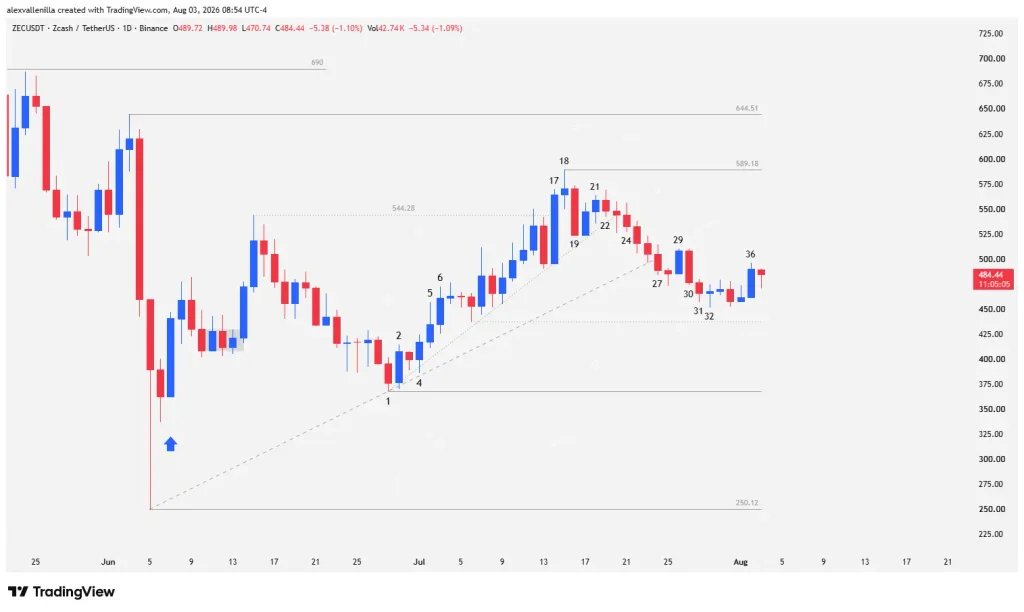
The bullish dynamic reaches its boiling point at bar 17, where smart money prints a high-conviction bullish candle. This shaved-bottom structure shows that buying appetite dominated the board from the very first second, successfully breaking through the local resistance located at $544.28. However, the nature of this bar—characterized as a climatic formation at the peak of a two-leg move—triggers technical alarms: this pattern usually precedes immediate corrections.
Bar 18 reflects the bulls’ failed attempt to maintain momentum from the previous move. Failing to close above the prior high, the market prints a doji that injects indecision. Price bumps into a wall before reaching the next major hurdle at $644.51, establishing a new local resistance at $589.18. Immediately, bar 19 responds with a high-conviction bearish candle that pierces the prior low, though it respects with surgical precision the short-term bullish trendline (22 bars) originating at the start of the move.
Bearish Exhaustion and Defense of Supports
Following the exhaustion generated by a micro bearish channel culminating at bar 27—breaking the longer-term 49-bar trendline—sellers lose steam. Bar 30 confirms the failure of a prior reversal attempt (bar 29), but bar 31 and bar 32 act as an institutional emergency brake.
Bar 32, shaped as a doji, halts the drop and sets a low at $437.73, comfortably respecting the structural support located at $368.03 and sitting well above the major support at $250.12. This behavior proves that, despite the correction, every pullback generates higher lows. Meanwhile, bar 36 confirms this technical floor by bouncing and testing the bearish trendline originating from the high of bar 18.
Macro Structure: Smart Money Dominance
ZEC’s macroeconomic outlook unfolds within an overall bullish structure. Price attempts to reverse the beating taken from the $644.51 zone down to the $250.12 floor.
| Metric / Key Level | Technical Value (USD) | Chart Implication |
|---|---|---|
| Local Resistance (Cap) | 589.18 | High selling pressure zone and current range limit. |
| Impulse Resistance | 644.51 | Macro target for bulls if the correction invalidates. |
| Local Support | 437.73 | Critical short-term floor validating higher lows. |
| Structural Support | 368.03 | Pivot point of the 49-bar trendline; bullish lifeline. |
| Major Support | 250.12 | Origin of the recovery and absolute floor of the move. |
Order flow analysis leaves a clear read: bullish impulses execute with high-volume, high-conviction bars driven by institutional investors, while corrections happen with narrow-range candles and multiple wicks. This proves that big capital leverages drops to accumulate, keeping the main trend’s health intact as long as $437.73 support resists selling pressure.
Zcash’s technical behavior shows that the current correction responds to a natural cooling phase following a two-leg impulse, rather than a structural trend shift. If buyers manage to shield local support and clear the $589.18 resistance, the market validates a new higher low, setting the stage to challenge preceding highs. Operational patience and strict price action monitoring serve as the best tools to navigate this scenario.
Disclaimer: This article is for educational and informational purposes only and does not constitute financial, investment, or trading advice. The cryptoasset market presents high volatility and risk of loss. Do your own research (DYOR) before making any investment decision.

Communications Professional. Crypto Enthusiast. Economic Journalist. Bitcoiner & Altcoiner.