Canton cryptocurrency (CC) faces a decisive technical restructuring on its daily chart. Following the breakdown of the prior uptrend and the demand’s inability to sustain the upper trading range, the asset developed a well-defined two-leg downward move. Sellers absorbed buying liquidity at key levels and are currently pressing price near structural support at $0.1069—a inflection point where the market will decide whether it undergoes a climax-exhaustion pullback or deepens its plunge toward historical lows.
From Congestion Range to Structure Breakdown
Price action in Canton (CC) began deteriorating formally when demand lost the ability to push the market above the upper liquidity pool. The shift from a consolidation structure to a free-fall trend unfolded through bull traps and consecutive breakout failures, ultimately handing complete order flow control to supply.
The breach of the prior range floor at $0.13459 shattered buyers’ hopes of reclaiming the previous trend, turning former support levels into unyielding resistance barriers.
Technical Price Action Analysis: Bar-by-Bar Narrative
The daily chart for Canton (CC) exposes the psychology behind the battle between supply and demand, revealing how progressive buyer capitulation accelerated the downward move.
First Bear Leg and Breakout Failure ($0.1757)
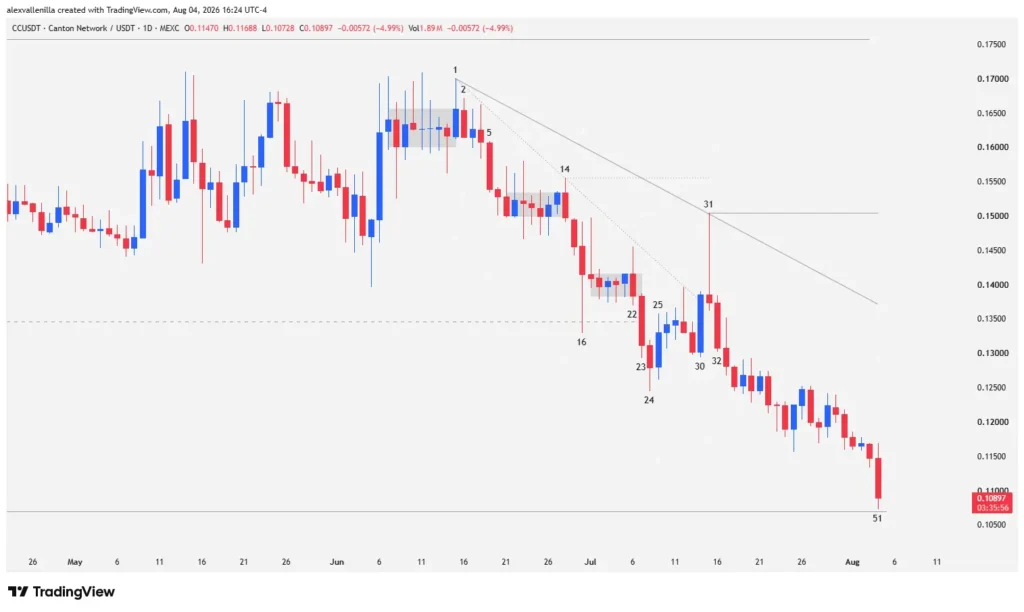
Bar 1: Bulls fail in their attempt to test the $0.1757 resistance, the level marking the ceiling of the trading range following the prior uptrend. Upper wicks account for over half of the bar’s size, signaling heavy selling pressure. Despite attempting to clear a prior micro-congestion range, the bar fails to break above previous candle highs.
Bar 2: An inside bar prints, confirming the pullback. Its body completely overlaps with Bar 1, validating demand’s lack of strength to target key resistance.
Bar 5: Bears pierce the low of Bar 4, trapping Bar 1 buyers and confirming the ultimate failure of the bullish breakout.
Bar 14: Following the initial push, price enters a new micro-congestion range. Bar 14 acts as an outside bar trying to break down the consolidation. Its high serves as the anchor point to draw a downward trendline projected over 29 bars.
Bar 16: Represents a climactic downward acceleration event that tested support at $0.13459 (the lower boundary of the prior range). This pin bar displays a massive lower wick, reflecting temporary buyer absorption in a zone that previously served as a bear trap. However, the market fails to generate bullish continuity and compresses price through Bar 22.
Structural Support Breakdown and Pause Phase
Bars 22 and 23: Bar 22 (bearish outside bar) anticipates the breakdown, while Bar 23 seals the sellers’ victory by closing convincingly below the low of Bar 22 and the breached $0.13459 support.
Bars 24 and 25: Bar 24 provides modest continuity on a narrow range. In Bar 25, demand attempts a counterattack to trap sellers, but momentum quickly dries up into two small doji bars denoting indecision.
Bars 30 and 31: In Bar 30, buyers step in with a high-conviction bar (virtually no wicks) that breaks the 29-bar micro-downtrend channel. However, Bar 31 invalidates this attempt: volatility spikes at the high, sellers absorb demand, and print an inverted hammer with a tiny body and a massive upper wick. This rejection establishes resistance at $0.1504 and adjusts the downward trendline to 50 bars.
Bar 32: Traps Bar 30 bulls once and for all, triggering a massive wave of selling that initiates the second bear leg. This period between Bar 22 and Bar 31 forms the pause phase of the overall move.
Second Leg and Current Outlook
Bar 51 (Developing Bar): Price extends its downward move, accumulating five failed reversal attempts since Bar 31. Bar 51 exhibits climax-acceleration characteristics near critical support at $0.1069, the most relevant anchor point of the original uptrend.
Trade Setup Scenarios and Outlook
The behavior of Bar 51 will determine the immediate future of Canton (CC):
Exhaustion-Pullback Scenario: If Bar 51 fails to pierce the $0.1069 support, the presence of this climax candle in an extended trend will favor a pullback toward immediate resistance at $0.1252 (the last relevant high of the bear impulse).
Bearish Continuity Scenario: If selling volume breaks the $0.1069 level, the structure projects a direct drop toward the $0.0582 zone, the origin point of the historical bull run that acts as a magnet due to residual liquidity concentration.
Canton (CC) completed a flawless structural transition from a range distribution phase into a two-leg downtrend. Price interaction at the current $0.1069 zone will dictate whether we see a technical exhaustion bounce or if supply deepens the sell-off toward multi-month lows.
Disclaimer: This article is strictly for informational and educational purposes. It does not constitute investment advice, financial recommendations, or a solicitation to buy or sell digital assets. Cryptocurrencies are high-risk assets, and price action can fluctuate drastically.

Communications Professional. Crypto Enthusiast. Economic Journalist. Bitcoiner & Altcoiner.