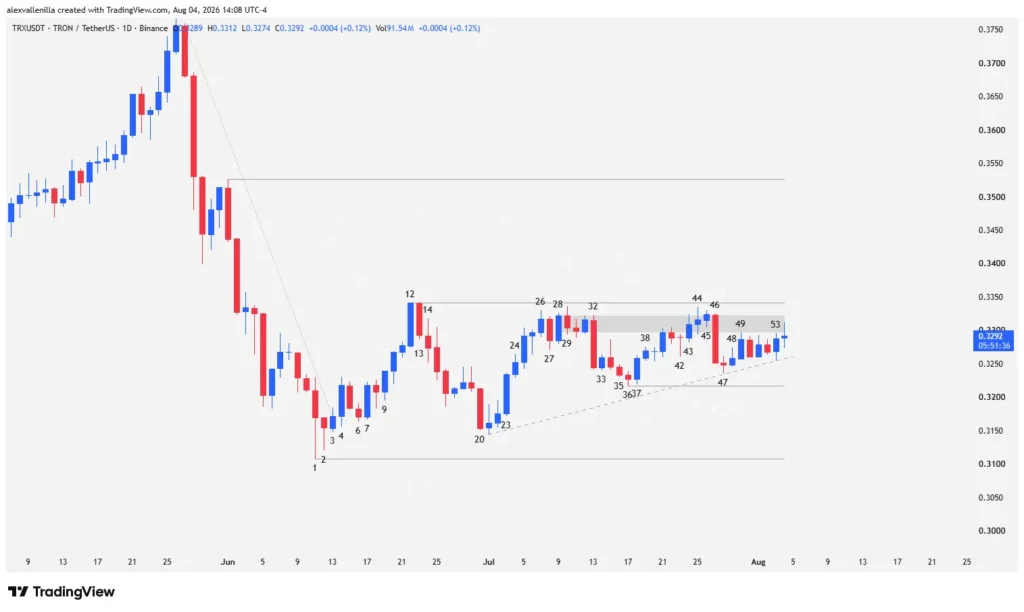
The Tron (TRX) market entered a critical price compression phase on the daily (1D) timeframe. After experiencing a steep pull-back from its high at $0.3775 down to a floor of $0.3108, buyers took control of the retracements, building a 43-bar ascending triangle. This chart pattern demonstrates persistent accumulation from buyers, absorbing supply along the 35-bar uptrend line and preparing a final assault on key resistance at $0.3341.
Macro Structure: Primary Trend Resilience
TRX price action maintains a dominant uptrend on higher timeframes. Within this context, investors disciplinedly execute a “buy the dip” strategy, taking advantage of price contractions to position themselves at a discount.
Despite buyer strength at the floor, the market shows resistance to giving up ground at the top. Supply interventions near $0.3341 (Bar 12 high) created bars with extended upper wicks and aggressive institutional rejections, like those observed in Bars 32 and 46.
Price Action Reading: Bar-by-Bar Battle
A detailed study of supply and demand through Japanese candlesticks helps decipher participant psychology during this congestion phase:
Floor Definition and Reversal (Bars 38 to 42)
Bar 38: Validated the Bar 37 Reversal by closing above its high. It established a higher low at $0.3217 (Bar 36 low) relative to Bars 21 and 1, confirming the lower-timeframe bullish structure.
Bar 42: After completing a two-bar pullback (41 and 42), Bar 42 closed as a Dragonfly Doji candle. Its extensive lower wick showed that buyers rapidly absorbed supply, successfully defending the 35-bar uptrend line originating at Bar 21 and adjusted at the Bar 47 low.
Resistance Rejection and the Second Attempt Rule (Bars 43 to 45)
Bar 43: Broke the Bar 42 high and triggered a pullback failure with high volatility. The candle penetrated the previous congestion zone (Bars 29 to 31) and tested $0.3341. However, the upper wick left clear evidence of selling pressure.
Bar 44: Printed a doji with extended wicks on both ends and a small body, registering buyer exhaustion after failing to close above the Bar 43 high.
Bar 45: Formed an Inside Bar that consolidated price. By registering a lower high than Bar 44 and failing a second time to break $0.3341, the market applied a classic price action principle: when demand fails twice to reach its target, supply temporarily takes control.
Institutional Selling and Trendline Defense (Bars 46 to 50)
Bar 46: Smart money executed a violent bearish move with a bar of total conviction. This bearish marubozu sliced through the lows going back to Bar 38 and closed near its low. However, price halted its drop just above the uptrend line.
Bar 47: A narrow-range doji contained the sell-off. This candle registered a higher low relative to Bars 36 and 21, serving as an anchor point to readjust the 35-bar trendline.
Bars 48 to 50: Bar 48 kicked off the bounce by exceeding the Bar 47 high. Bar 49 confirmed the reversal by closing in its upper range, clearing the way for Bar 50 to compress along the trendline.
Current Context (Bars 53 and 54)
Bar 53: Buyers deployed a bullish Outside Bar. Its low tested the 35-bar trendline with pinpoint precision, while its high attacked the upper congestion zone once again.
Bar 54 (In Progress): Demand pushes to extend the momentum from Bar 53, attempting to force the ascending triangle breakout before the session close.
Trading Scenarios and Outlook
TRX is in the final stage of a volatility compression process. A daily close above the $0.3341 level will validate the ascending triangle breakout and project price toward resistance at $0.3526.
Conversely, if bears manage to slice through local support at $0.3217, the structure will lose steam and retest the range base at $0.3108. Losing $0.3108 invalidates the medium-term bullish thesis, opening the door for a deep correction toward the $0.2790 area, which would complete a two-legged move from the high at $0.3775.
Disclaimer: This analysis is provided for informational and educational purposes only. It does not constitute financial, legal, or investment advice. Digital asset markets carry high volatility; conduct your own research before making trading decisions.

Communications Professional. Crypto Enthusiast. Economic Journalist. Bitcoiner & Altcoiner.