

Tron (TRX) is currently navigating a technical consolidation phase on its daily chart, maintaining a structure of higher lows following a sharp correction. Despite breaching critical control points, recent price action reveals a tug-of-war between bullish strength attempting to reclaim the primary trend and selling pressure exhausting itself near $0.3341.
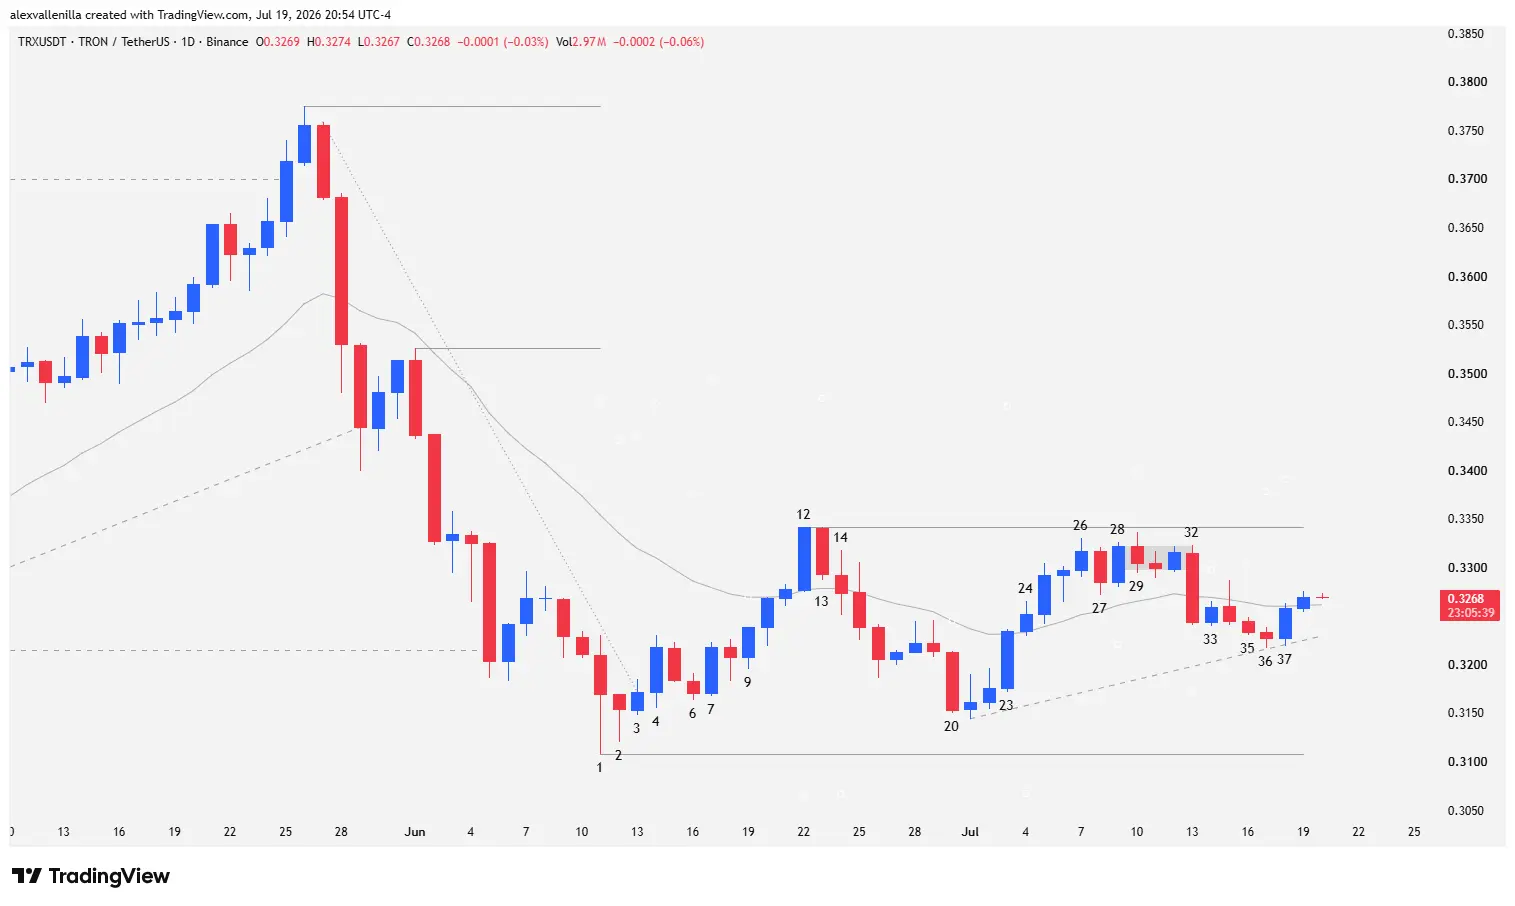
Anatomy of the Sell-off and Accumulation Phase
The technical structure initially formed with Bar 1, a bearish pin bar that represented the third leg of a deep correction, finding technical support at $0.3108. This level solidified the prior break of $0.3215, the control point of the 86-bar uptrend.
Market sentiment shifted radically with Bar 20. Although it appeared as a high-conviction bearish bar, its inability to test the $0.3108 support and the lack of follow-through validated it as a bear trap. Within the context of a structural uptrend, this setup triggered a “buy the dip” strategy, allowing institutional investors to absorb the supply.
Price Evolution and the Battle for Local Resistance
Price action transitioned from initial panic to a phase of technical compression:
Recovery and FOMO: After the failure at Bar 20, bulls pushed the price to the high of Bar 12, which marked $0.3341. By breaking above the 20 EMA with a climactic range, this bar exhibited classic FOMO characteristics, naturally attracting immediate profit-taking.
Signs of Selling Exhaustion: Between Bar 26 and 29, the market showed an inability to break resistance. However, Bar 29 consolidated as a “failure of a failure,” sending the price into a micro-range of indecision.
Ascending Triangle Formation: The market developed higher lows starting from Bar 1 while compressing against the $0.3341 resistance. Bar 36, a narrow-range doji, confirms the bears’ weakness to continue the decline, priming the asset for a definitive technical breakout.
Market Scenarios: Targets and Projections
TRX price remains under the influence of its primary uptrend. The current structure presents two probable outcomes for the coming days:
Bullish Breakout: A consistent move above the $0.3341 resistance would trigger a measured move, projecting a technical target toward $0.3574.
Correction Continuation: If bulls fail in their attempt and the price breaks the $0.3108 support, the correction could resume toward the origin of the trend, located at $0.2790.
Current price compression suggests that market participants are positioning themselves for a spike in volatility. As long as the price maintains higher lows, the bullish context remains valid, though clearing local highs stays the primary hurdle for Tron.
Disclaimer: This technical analysis is for educational purposes only and does not constitute financial advice. Cryptocurrency trading carries a high risk of capital loss. Always conduct your own research before trading.

Communications Professional. Crypto Enthusiast. Economic Journalist. Bitcoiner & Altcoiner.


