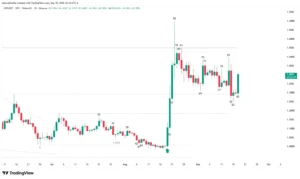
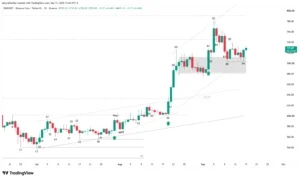
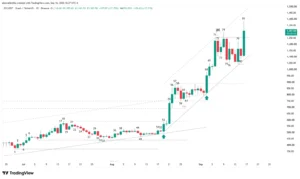
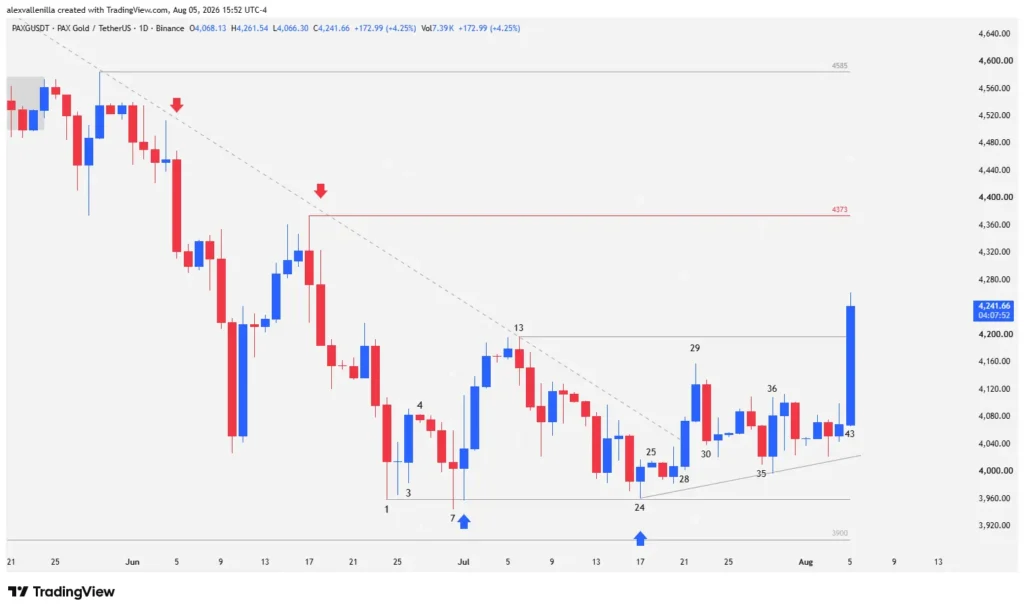
PAX Gold (PAXG), Paxos’s physical gold-backed digital asset, locked in a decisive bullish breakout after consolidating for 42 sessions in a micro trading range. Daily timeframe (1D) price action confirmed sellers’ inability to breach structural support at $3,959, triggering high-conviction buying momentum. This push broke the 70-bar downtrend line and cleared intermediate resistance at $4,197. The move places the crypto asset under scrutiny at the critical $4,373 zone—a pivot level that defines the medium-term market structure.
Market Anatomy: Institutional Momentum and Supply Absorption
PAX Gold‘s recent price action reflects a clear shift in order flow. Following multiple attempts by bears to drive price below the $3,959 floor, aggressive buy-side volume stepped in at dynamic support levels. Chart interaction points to institutional capital executing systematic buys, absorbing selling liquidity, and invalidating the bearish dominance seen over recent months.
Technical Price Action Analysis: Bar Sequence (1D)
Testing and Failure of Primary Support (Bars 24 to 25)
Bar 24 retested structural support around $3,959 (Bar 1 low). Sellers failed to touch or break this level, marking a double bottom failure to extend the downtrend that began at Bar 13. In market psychology, when supply fails twice to break a key level, order flow flips in the opposite direction. Bar 25, an inside bar with a bullish body, immediately confirmed the buy-side response and technical bounce.
Breaking Long-Term Bearish Structure (Bars 28 to 29)
At Bar 28, bulls entered the market aggressively to defend the structural low. They printed a high-conviction candle featuring a wide bullish body and virtually no lower wick (an implicit bullish marubozu). This bar cleanly pierced and broke the downtrend line that dominated the last 70 bars. Bar 29 provided continuation to the breakout, though it left a noticeable upper wick near the Bar 13 swing high resistance ($4,197), leaving an untested gap above that ceiling.
Supply Absorption and Pullback Failure (Bars 30 to 35)
Bar 30 represented a counterattack attempt by institutional bears. Supply defended the $4,197 level, engulfing the Bar 29 low with a wide-range candle. However, Bar 31 invalidated bearish continuation by closing as a bullish doji, turning Bar 30 into a bear trap and a failed pullback. Bars 34 and 35 showed fading sell pressure; Bar 35’s body, while solid, traded within a tight range that failed to pierce the lows of Bars 28 or 24, printing a higher low.
Channel Building and Micro-Range Compression (Bars 36 to 42)
Bar 36 brought volatility back into play as an outside bar with wicks on both ends. This bar’s low served as the key anchor point to plot the new uptrend line from Bar 24. From there, price compressed into a micro range between Bars 38 and 42, consistently respecting dynamic support along the uptrend line.
Institutional Breakout and Resistance Projection (Bar 43)
Bar 43 (developing bar prior to close) shows absolute buy-side control. With no lower wick, buy orders executed right from the open. This expanded-range candle solidly confirmed the breakout above Bar 13 resistance ($4,197).
Outlook: This breakout opens a direct path toward testing key resistance at $4,373. Consolidation above this target would decisively invalidate the bearish market structure, clearing the way for a broad accumulation phase or a new medium-term uptrend.
Shifting Narratives in Digital Commodities
Price action points to a clear rotation of capital into tokenized safe-haven assets. After spending 42 days trapped in a lateral range between $3,959 and $4,197, the demand imbalance confirms seller exhaustion. Holding dynamic support at $4,023 will be critical to sustaining upward momentum in the coming sessions.
Disclaimer: This article is strictly for informational and educational purposes. The technical analysis presented here does not constitute financial advice, an investment recommendation, or a solicitation to buy or sell any digital asset. Trading digital assets involves a high risk of capital loss.

Communications Professional. Crypto Enthusiast. Economic Journalist. Bitcoiner & Altcoiner.