
The Real World Assets (RWA) market experiences a severe structural shakeup this Friday, June 19, 2026. The price of the physical gold-backed token, PAX Gold (PAXG), consolidates a persistent corrective structure on its daily chart (1d), trapped in a secondary bearish channel that has already accumulated 112 bars. Despite sustaining a primary macro uptrend of 842 sessions, institutional order flow has taken absolute control of price action. The definitive break of critical support levels and the appearance of high-reliability technical sell setups suggest that smart money is executing a systematic liquidation, leaving the asset exposed to deeper pullbacks if demand fails to absorb the current liquidity void.
The Retreat of the Digital Safe Haven Against Institutional Rigor
PAXG’s price action over recent sessions reflects a profound shift in trader psychology. After reaching historical benchmark highs earlier this year, the crypto asset suffers under the weight of relentless supply that neutralizes every recovery attempt by the bulls. Institutional dynamics are not driven by panic, but rather by a surgical and efficient distribution of capital.
The price pierced through barriers that previously served as safe accumulation zones. The bulls’ inability to hold prices above key market moving averages demonstrates that the highest-liquidity participants prefer to take profits or rotate into more dynamic hedges, stripping the token of its medium-term upward momentum.
Violated Supports and the Threat of a Structural Correction
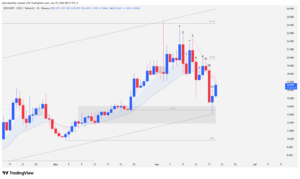
The epicenter of the technical debate now shifts to macro control zones. The recent loss of the key support level at $4,141 accelerated bearish order flow, forcing the price to hunt for technical interaction zones not visited in hundreds of sessions.
Although the Paxos tokenized asset attempts to build solid bases to halt the bleeding, current market geometry favors bearish continuation. Specialists are evaluating whether immediate demand zones will be dense enough to stop a deeper slide that threatens the structure of the primary trend.
Technical Analysis (Highest Priority)
A meticulous breakdown of price action using pure Japanese candlestick reading reveals the market’s psychological narrative, identifying step-by-step the interactions between supply and demand without lagging indicators:
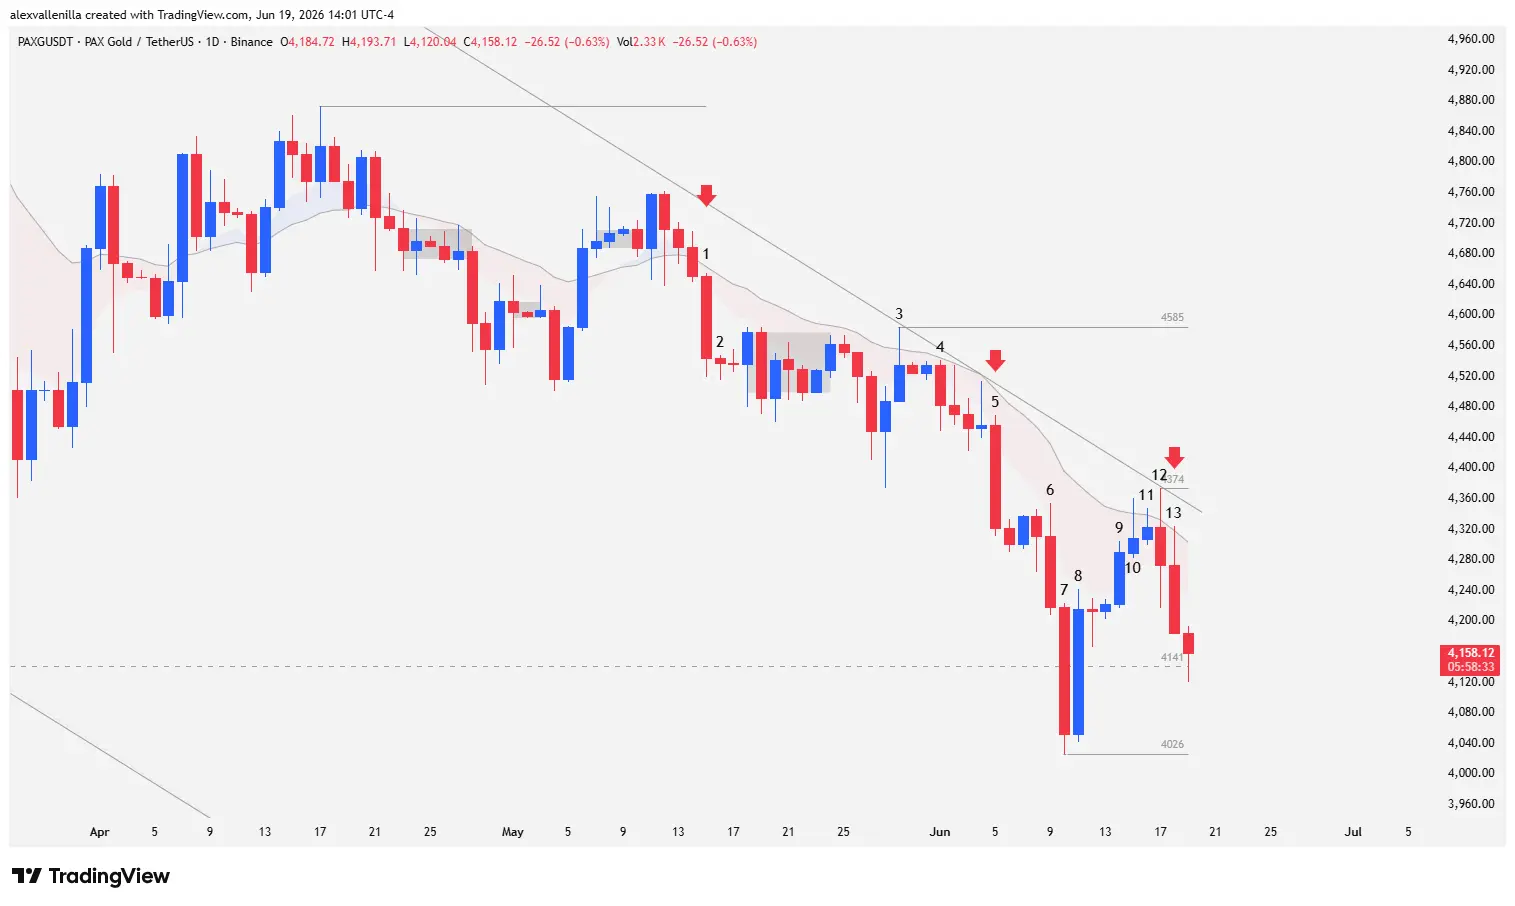
Bar 1: A bearish conviction bar that exposes the direct positioning of institutional smart money. Selling pressure begins virtually from the open. Technically, it prints a highly reliable Low 2 sell setup, locating its body entirely below the 20 EMA after testing the descending trendline on the upper side of the counter-trend channel (112 bars).
Bar 2: This small bearish session does not generate immediate continuation, but its low pierces the low of Bar 1, triggering stop-sell orders resting in that zone. Subsequently, price action enters a micro-range or a two-bar congestion pattern. Although a subsequent bearish candle breaks this range, the next wick fails to provide follow-through, trapping sellers into a bullish reversal attempt via a pinbar.
Bar 3: Bulls attempt to regain the initiative, looking to breach the 20 EMA and the top of the bearish channel. The move fails completely, printing an upper wick significantly larger than the candle body. This failed breakout consolidates the price below dynamic resistance levels for the next two sessions.
Bar 4: A decisive bearish candle that breaks the previous micro-congestion, strictly maintaining bear hegemony below the 20 EMA.
Bar 5: Bears take absolute control of the market with a high-conviction bar. The near-total absence of wicks (just a minuscule upper and lower shadow) demonstrates a highly efficient effort where the body fills the range completely. By placing its high below the 20 EMA after the failed test of Bar 3, it transforms into a solid continuation signal for the drop.
Bar 6: A wide-range candle with institutional conviction that confirms and accelerates the market’s bearish bias.
Bar 7: Dramatic range expansion. This bar is substantially larger than Bar 6, which was already larger than its predecessor. This geometric acceleration defines a climatic or capitulation drop. Bears manage to pierce key support at $4,141, establishing a low at $4,026. The lack of a test at the long-term macro support located at $3,900 (inactive for 234 bars) creates a liquidity void that immediately attracts buyers.
Bar 8: A powerful response from demand. Bulls print a high-conviction bar that reverses the price above the high of Bar 7. The low of this session does not even touch $4,026. Although it acts as a counter-trend move in the medium term, within the macro context of the 842-bar uptrend, it operates as a perfect bear trap.
Bar 9: Moderate bullish continuation that gives way to two sessions of tight consolidation.
Bar 10: Bulls push and manage to momentarily pierce the 20 EMA. However, the inability to close above this level converts the session into a first failed breakout.
Bar 11: An inside bar with a very narrow range that executes the second consecutive test of the 20 EMA. The new rejection confirms a double bullish failure; price action theory dictates that when the market fails twice at the same target, it tends to execute the opposite move. The candlestick pattern decreasing in size confirms clear deceleration and loss of bullish momentum.
Bar 12: The appearance of an outside bar expands volatility and closes lower after an intense battle. Its high breaches the high of Bar 11 and its low does the same to the previous one. The upper wick tests the channel’s descending trendline and the 20 EMA, but supply traps prices and pushes them back down to the lower zone. The close below the lows of bars 10 and 11 completely dilutes the buying effort against a massive injection of sell orders.
Bar 13: A confirmation candle of the bearish reversal proposed by the previous session. Its structure features a shaved close at the bottom, proving that bears pushed until the very last second of the day. Structurally, it validates as a high-probability Low 2 sell setup. At the time of writing, the subsequent session is piercing the low of Bar 13, formally triggering market sell orders.
The loss of momentum from buyers at dynamic resistance zones leaves PAXG in a highly vulnerable technical position. If the current bearish order flow maintains its dominance and definitively breaks immediate support at $4,026, the price will be dragged down to test macro support at $3,900. The highest-probability scenario points to the asset targeting the base of the primary ascending channel in the $3,700 area, invalidating the probability of an immediate bullish reversal unless demand manages to forcefully reclaim key resistance at $4,374.
Disclaimer: This analysis is for strictly informational and educational purposes based on price action reading and does not constitute, under any circumstances, investment advice, financial recommendation, or an offer to buy or sell crypto assets or financial derivatives. Digital markets feature high volatility; trade at your own risk and analysis.
Communications Professional. Crypto Enthusiast. Economic Journalist. Bitcoiner & Altcoiner.